Supporting Myopia Management with the Help of Percentile Curves
With a Comparison of German and Chinese Data


Supporting Myopia Management with the Help of Percentile Curves
Fill in the abstract
Introduction
This article was first published in xyxy.
Myopia is no longer considered only as refractive error of the eye, shifting the focus from just “correction” of that refractive error to the management of its progression as well as focusing on its clinical risks in later stages of life. This is due to the fact that the incidence (prevalence) of myopia has increased consistently over the past decades and this trend is predicted to continue. For example, it is predicted that in 30 years, approximately half of the world's population will be myopic, and minimum of 10% will be highly myopic with more than 5 dpt (Holden et al., 2016). It should also be noted that myopia prevalence differs around the world. In Asia, for example, high myopes occur significantly more frequently and earlier (Sankaridurg et al., 2021). This may be due not only to genetic risk factors but also to a change in the behavior in daily life. In the Asian region, school and learning periods are longer and children spend more time indoors with activities at close distance. In contrast, studies have shown that time spent outdoors reduces the occurrence and progression of myopia (Cao et al., 2020; Sherwin et al., 2012). Besides this, there are other options for managing the progression of myopia, such as eyeglasses, contact lenses, or eye drops. Myopia management is necessary to reduce potential clinical risks as myopia is largely caused by excessive eye growth. Moderate and high myopia / medium and long eyes are associated with an increased risk of various eye diseases with potentially irreversible loss of vision. For example, the risk of retinal detachment is increased by a factor of 3 (for an spherical equivalent refractive error of 3 dpt) and by an factor of 22 (for an spherical equivalent refractive error of at 9 dpt), while macular degeneration is approximately 350 times more common in myopes and occurs earlier in life (Flitcroft, 2012).
However, the practitioner is often faced with the question at what point a child with a given eye length or refractive deficit requires myopia management. This assessment becomes even more complicated due to the process of emmetropization. A physiological – in other words normal – eye growth occurs in parallel, and this has to be differentiated from an unwanted myopic eye growth. Here, the differentiation of the observed growth as well as a risk assessment of myopia progression and, if necessary, subsequent intervention decisions can be simplified by the use of so-called percentile curves.
The principle of growth curves applied to ocular parameters
In humans, percentile curves generally represent the distribution of a particular body characteristic over age – usually separated by sex – and have long been used in other fields of pediatric care. A well-known example of this are standard curves for classifying body height or weight in pediatrics. Suppose a 16-year-old boy is 173 cm tall. This would place him at the 50th percentile (median), i.e. 50% of all 16-year-old boys are shorter – and therefore 50% of all 16-year-old boys are taller, meaning he is of normal height. If the boy had a height of 185 cm at the same age, he would be on the 97th percentile according to the norm curve, i.e. 97% of his peers are shorter, while only 3% are taller than him. Here the very high or low percentiles represent the distribution ranges further away from the normal value.
The principle of growth curves described above can also be applied to ocular parameters, such as length of the eye (in mm) or its refractive error (in case of myopia and its management, especially the spherical equivalent refractive error). It is important here that such curves represent the relevant ethnic group – i.e. data from Europe, for example, when classifying the eyes of Caucasian children. The growth curves shown in Figures 1 to 4, which are explained in more detail below, were created using data collected during the "LIFEchild" study. The LIFEchild study takes place at the Leipzig Research Center for Civilization Diseases and is conducted in collaboration with ZEISS Vision Care. In total, around 2000 children are included in the study, who have their objective refraction and eye length measured annually, starting already in 2014. This makes the LIFEchild study one of the largest ongoing longitudinal studies in Central Europe. The growth curves for European children described below were generated from these data.
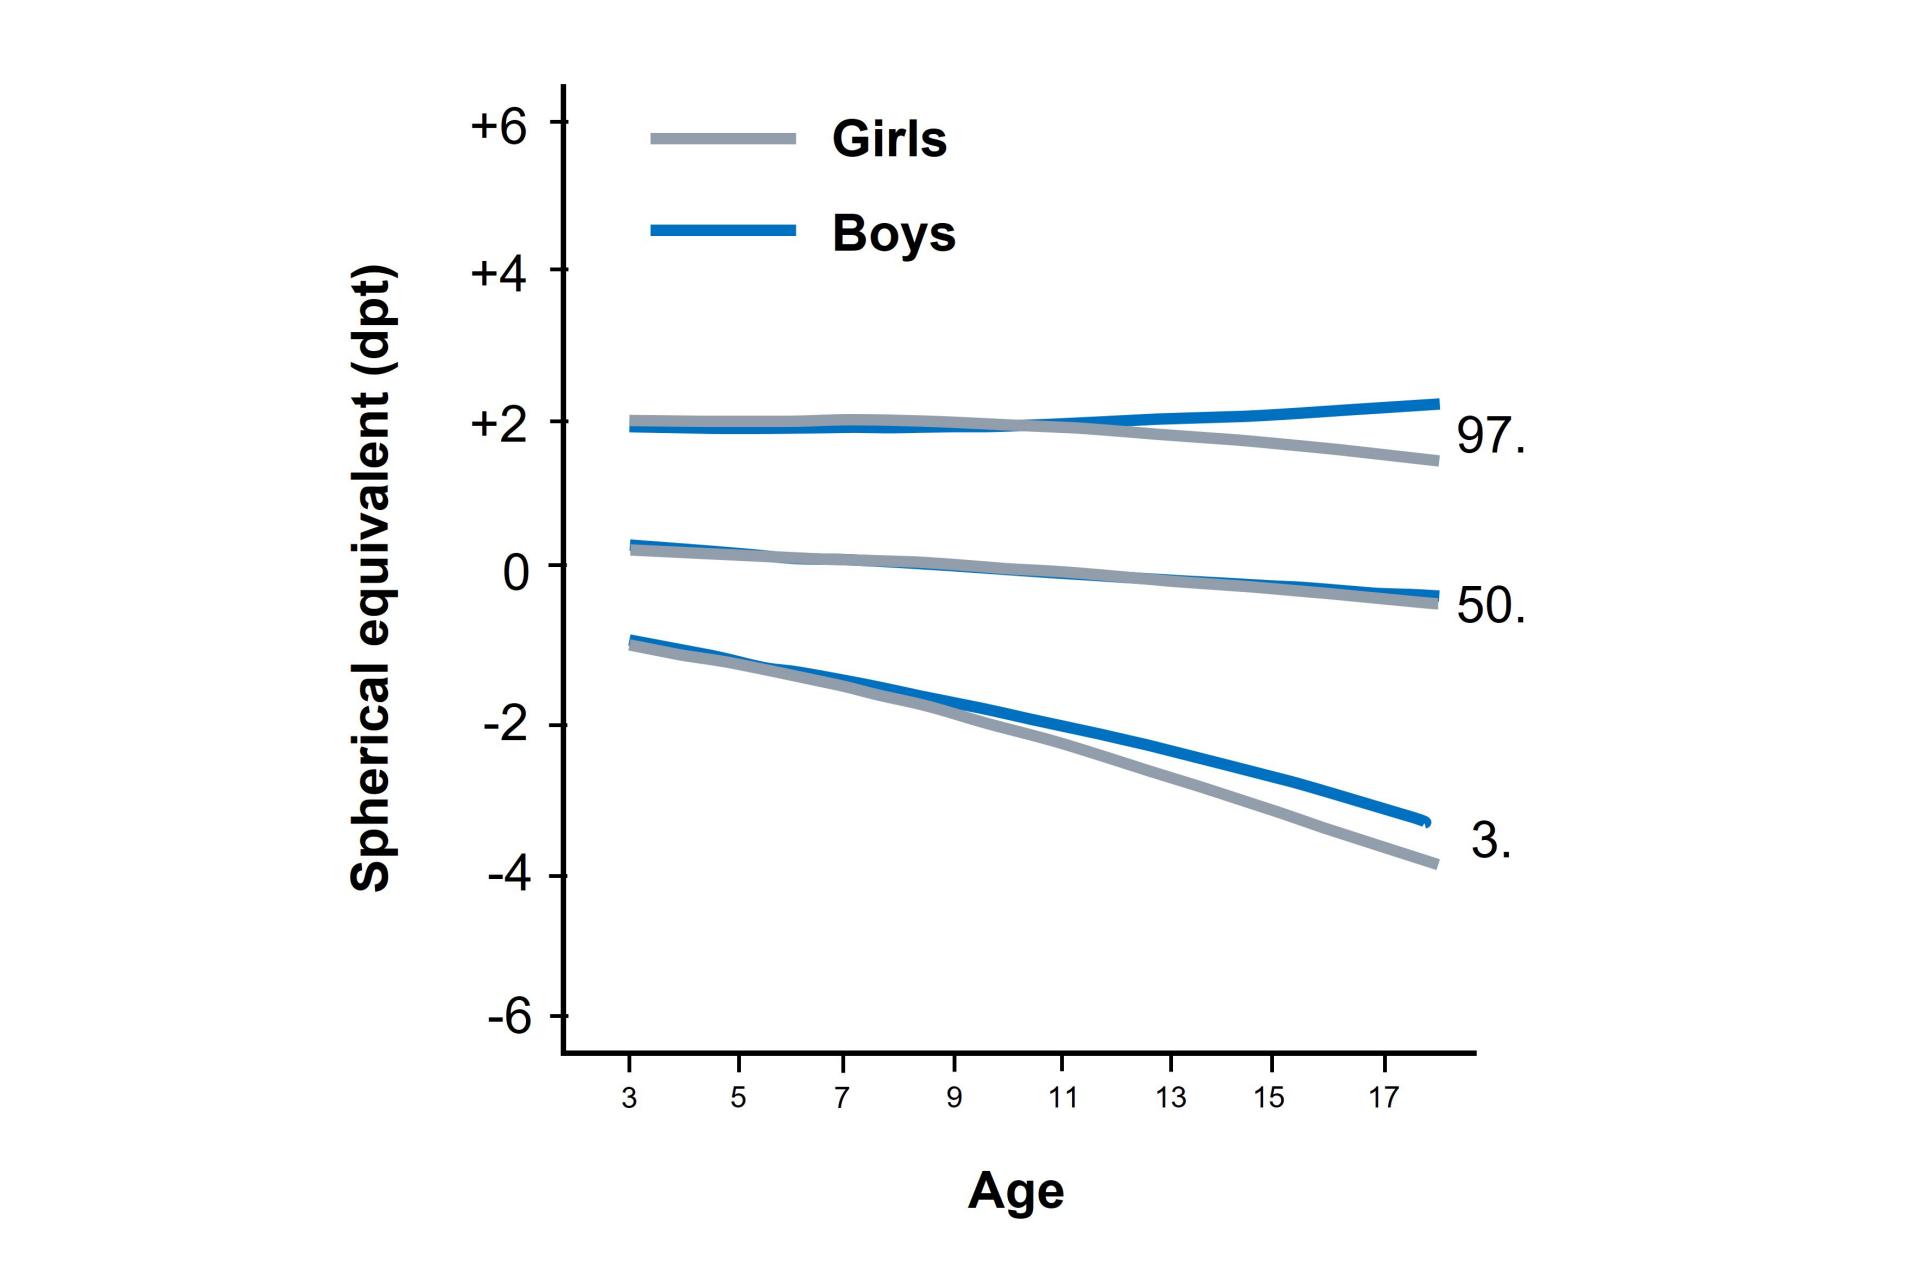

Figure 1: Curves for the 3rd, 50th, and 97th percentiles for spherical equivalent (dpt) for girls and boys from the LIFEchild study (adapted from Truckenbrod et al., 2020).
Growth curves for the objective spherical equivalent without cycloplegia
The growth curves for the objective spherical equivalent without cycloplegia with the 3rd, 50th, and 97th percentiles for girls and boys aged 3 to 17 years are shown in Figure 1 (Truckenbrod et al., 2020) and the following conclusions can be drawn from this:
- With increasing age, the 50th percentile (median) shifts towards myopia. Between 3 and 18 years of age, this shift is approximately 0.70 dpt. At the age of 11 years, the transition from plus values (hyperopia) to minus values (myopia) takes place.
- The upper percentiles (hyperopic refraction) generally show a less pronounced decrease in spherical equivalent over age than the lower percentiles (myopic refraction). This suggests that the rate of myopia progression increases with higher baseline myopia, which has been published in other research.
- In the 3rd percentile, the curve is steeper and steeper in the downward direction –children who are on this curve, myopia progresses increasingly faster with age.
- The curves for girls and boys do not differ from a clinical perspective in the 50th percentile, and show a tendency for a shift towards higher levels of myopia with age for both, boys and girls. At the 3rd and 97th percentiles, the data do not show differences between the sexes at age 3 years and above. However, from primary school age the curves drift apart and girls show more myopia than boys – cf. 3rd percentile at 18 years: girls with 3.00 dpt vs. boys with 2.50 dpt.
Comparing European and Chinese Data
Comparing European data on percentiles of axial length (solid lines) and similar data from Chinese children (dashed lines) as shown in Figure 2 (Truckenbrod et al., 2021) show some different trends and behavior. The physiological eye growth of the European children during emmetropization can be recognized by looking on the 50th percentile. While the eye is approximately 17 mm long at birth (not shown, Fledelius, 1992), it grows to about 23 mm in young adulthood. In general, boys seem have to slightly longer eyes than girls and this difference is more pronounced in the higher percentiles and is becoming smaller with increasing age. It is also obvious that data from the European and Chinese children differ significantly. The European extreme 98th percentile is approximately at the level of the still moderate 75th percentile in China. In other words, while an eye length of approximately 25 mm at 15 years of age falls into the 98th percentile in Europe and so is considered extremely long, it would fall into the 75th percentile in China and would therefore be considered only slightly above average in length there. Conversely, a 15-year-old child would have to have an eye length of about 27 mm to fall into the 98th percentile in China. Within the same percentiles of both regions, however, the growth rates are comparable.
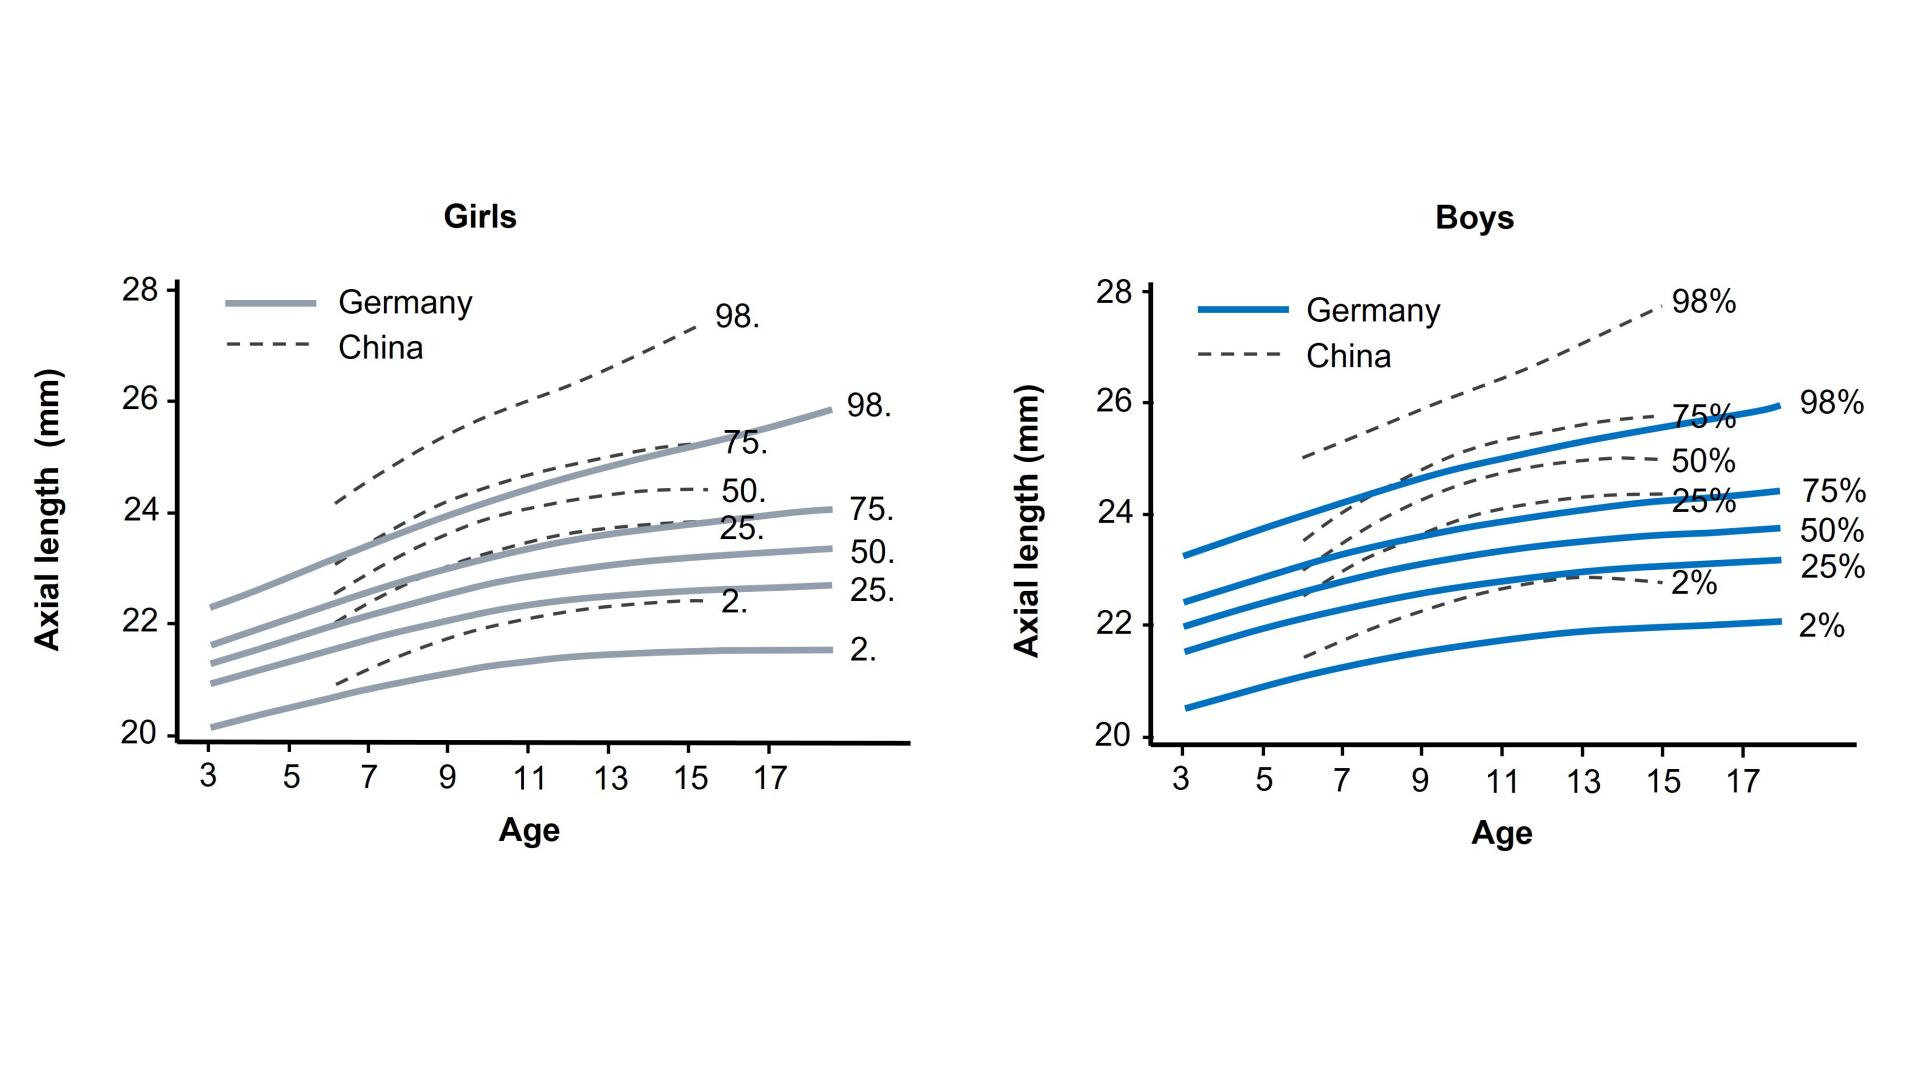

Figure 2: Growth curves for eye length (mm) for girls and boys compared to data from China (adapted from Truckenbrod et al., 2021).
Percentage probability of developing myopia
In Figure 3 (Truckenbrod et al., 2021) the previously described percentiles of axial length are translated into a percentage probability of developing myopia. Here – also in the left graph – the curves of girls are shown and below the curves of boys (solid lines: European data, dashed lines: Data from China in comparison). The following conclusions can be drawn from the curves:·
- Between 8 and 12 years, a rapid increase in myopia probability is visible, especially above the 50th percentile. Before and after that age range, a more stable phase can be observed. In China, this increase occurs earlier from 6 years of age, as well as much more extreme values of the probability to get myopic are visible.
- Children who are in higher percentiles at a young age have the highest likelihood of becoming myopic later in life.
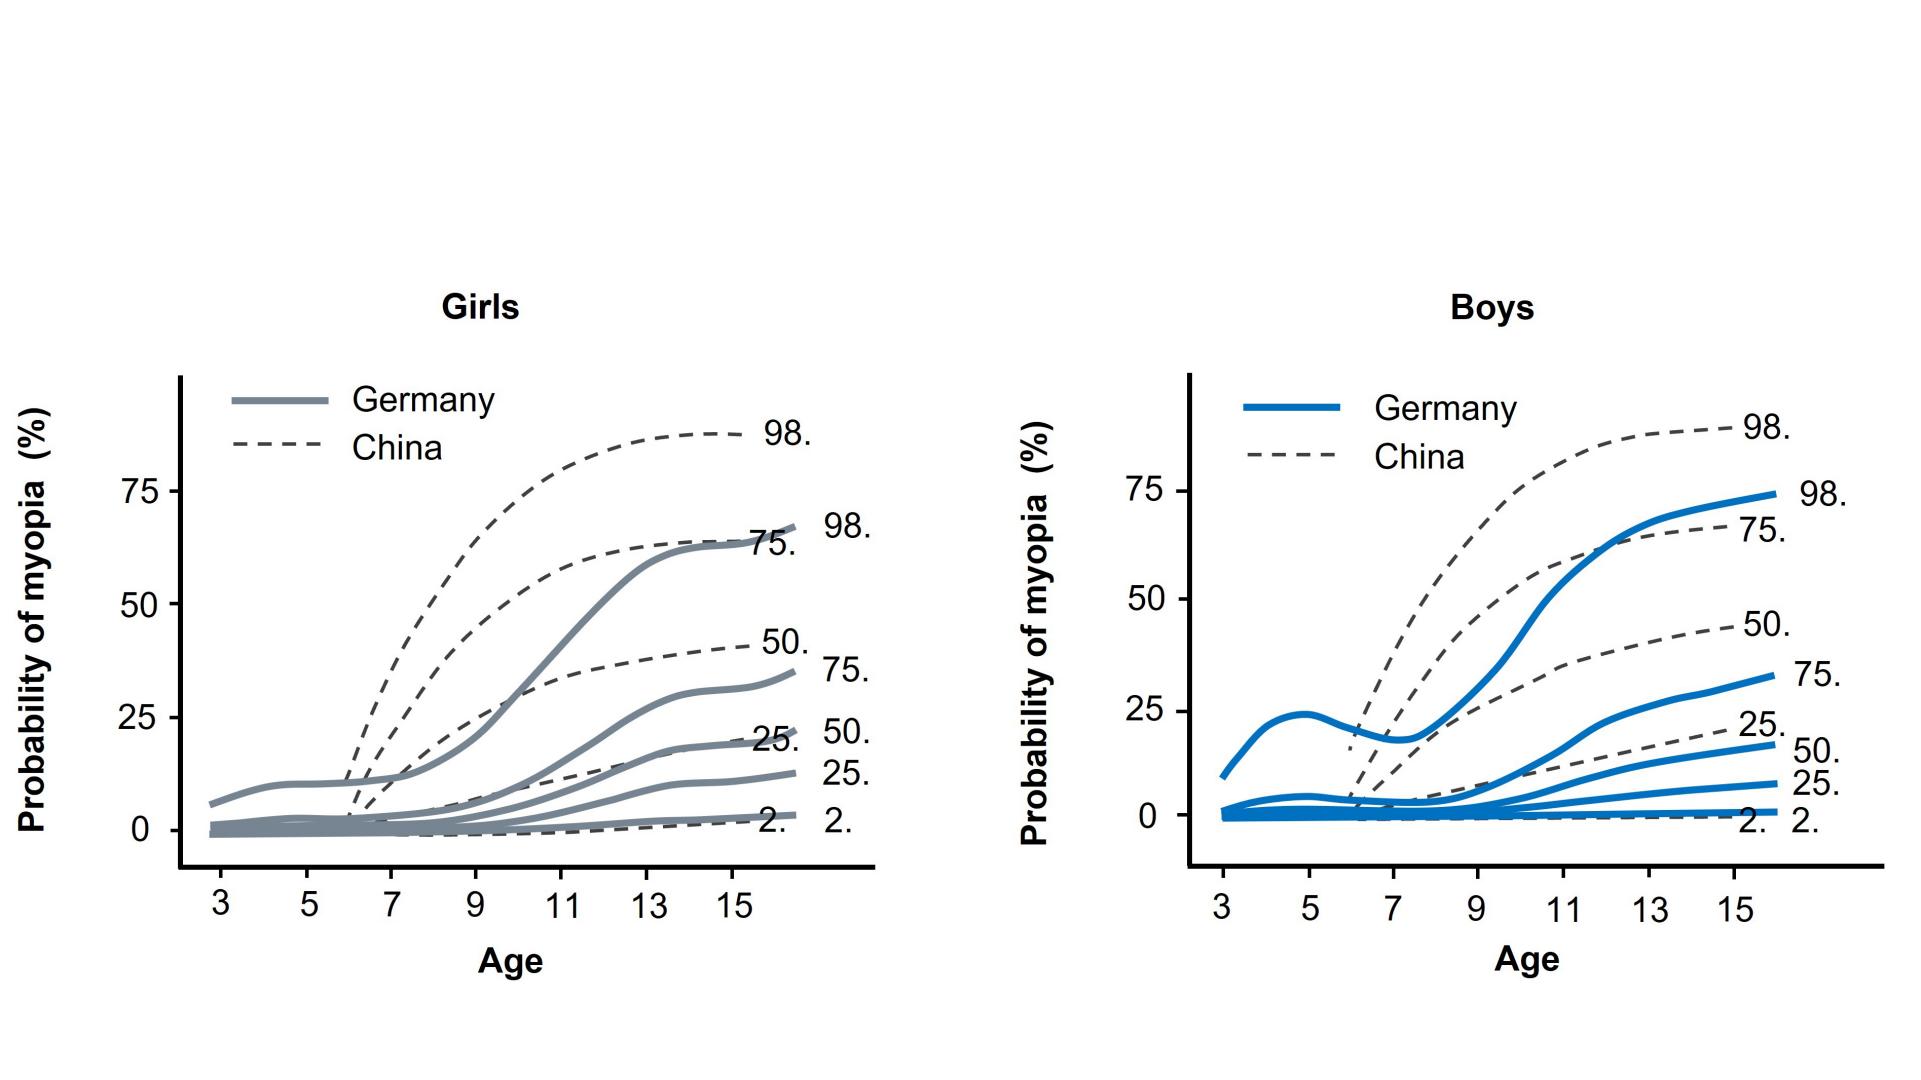

Figure 3: Transfer of percentiles for eye length into percent probability of myopia (adapted from Truckenbrod et al., 2021).
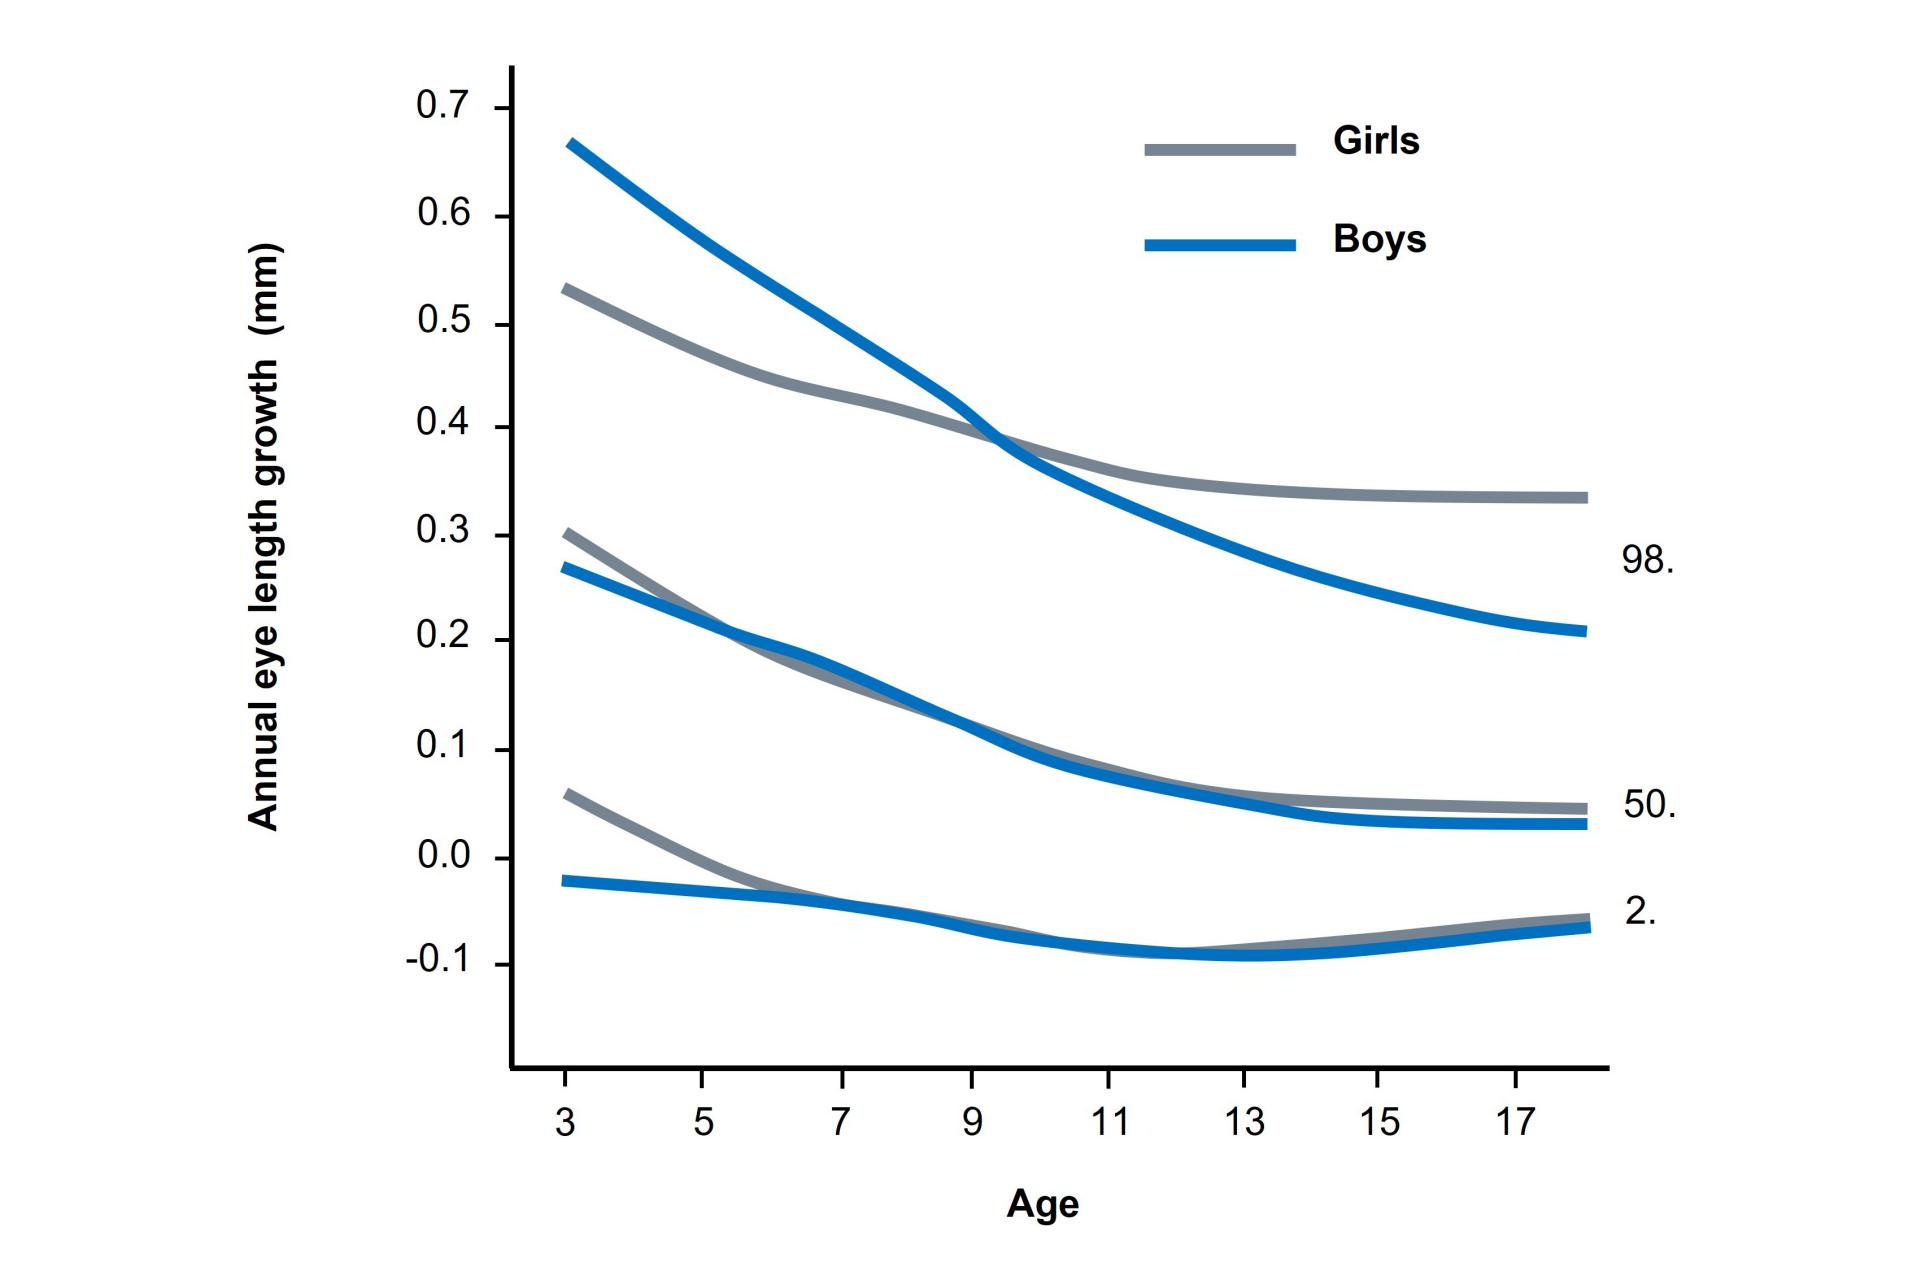

Figure 4: Growth curves for annual eye length growth (mm) for girls and boys from the LIFEchild study (adapted from Truckenbrod et al., 2021).
The annual eye length growth
The annual eye length growth in mm for girls and boys is plotted in Figure 4 (Truckenbrod et al., 2021) and the following results can be derived from this:
- Mean annual growth slows and stabilizes with age from 0.30 mm at 3 years to 0.05 to 0.10 mm from 13 years onward.
- This trend can also be observed in the extreme percentiles, but with different absolute numbers. In the 2nd percentile, almost no eye length growth occurs from the age of 13 years and above, whereas in the 98th percentile the eye still growths until the age of 17 years and above – and so a fast myopia progression can be assumed here.
- Gender differences are particularly visible in the 98th percentile. Boys show faster eye length growth before the age of 9 years, while this relationship reverses thereafter. Again, this indicates stronger myopic refractive errors in girls from puberty onwards.
Optimal management of myopia
The described findings are based on research regarding the development of the juvenile eye. In order to implement this knowledge into the day-to-day business of the ophthalmic/optometric practice, further attention is required in order to provide an optimal management of myopia to the myopic child, as can be seen in Figure 5. Each child forms the center as an individual with a different personal and environmental situation and for each individual, any level of myopia that can be reduced in progression matters.
In the next circle around the center in Figure 5 are all factors that are related to the know-how of the single eye care professional (either a dispensing optician, optometrist or ophthalmologist). The first step here is on the one hand to start raising the awareness of myopia especially in parents (typically via flyers, advertisements or social media), while on the other hand having a professional communication with the parents and their children visiting the eye care professional based on scientific and clinical insights into myopia and its development. The second step is the use of an efficient standard operation procedure (SOP) in order to conduct not only all relevant measurements but to do a proper anamnesis and risk analysis. In case of uncertainties regarding the results of such an initial visits regarding the next steps, it is often helpful to plan a second visit three to six months later in order to re-evaluate the situation, as also recommended by the International Myopia Institute (IMI) (Gifford et al., 2019). Shorter intervals are less useful, as very small changes e.g. in refractive error or length of the eye may be not detectable due to the repeatability of the equipment that is used to measure refractive error and/or axial length. In case the child requires myopia management, the appropriate intervention strategy must be selected next (step 3). The selection of the best intervention is the most complex decision to be done in the field of myopia management and is based on parents' wishes, compliance of the children, severity of the myopia progression and, last but not least, the current study situation for the different available solutions as well as the recommendations by IMI and/or the availability of products in the respective market. More time outdoors (in Europe about 1.5 hours per day) and a maximum of 2 hours per day in front of digital devices as behavioral strategies to reduce the progression of myopia need to be advised additionally. Subsequent follow-ups depend on the intervention chosen for myopia management and the individual progression – although, in practice a period of approximately 6 months has become the norm. In most cases, myopia management is not completed until young adulthood at 18 to 20 years of age or when the management treatment has resulted in growth of the eye that can be described as physiologically "normal" (see growth curves from Figures 1, 2, and 4). Further regular check-ups should of course continue to be recommended and offered to every myope.
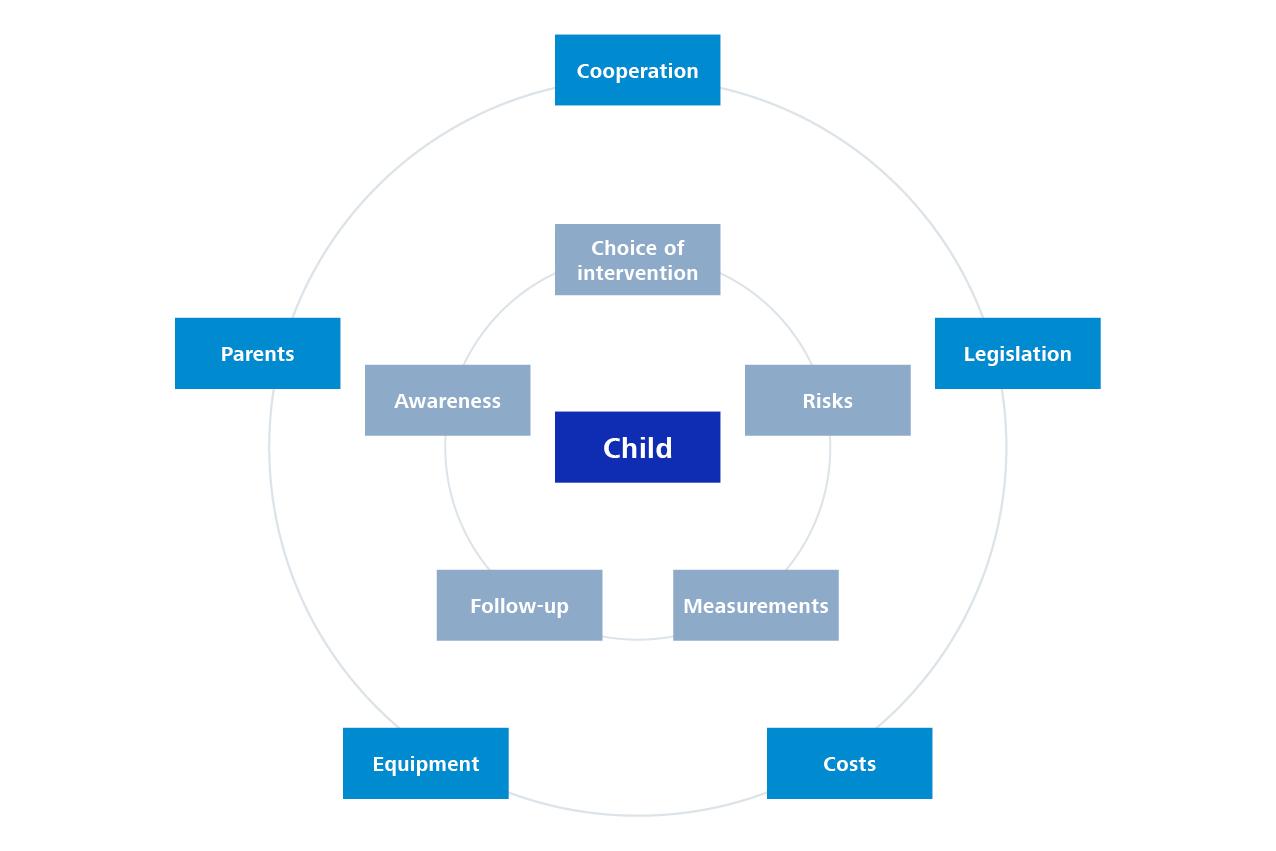

Figure 5: Factors that play an important role in translating myopia management from theory to practice.
The outermost circle in Figure 5 describes all external factors that an eye care professional cannot influence in the context of myopia management. These include legislative principles that describe for example the duties and rights of the individual eye care professional that differ between countries. Furthermore, the needed equipment (either technological, personal or space in the store) for a proper management of myopia can represent a limitation on the individual level. Next, the cooperation between optometrists and ophthalmologists can be very useful to ensure the best possible care for the child. Last but not least, pricing and cost can play a limiting role. In a survey conducted by the Aalen University of Applied Sciences (Germany), parents indicated that they would be willing to pay an average of €40 per month for the care of their child, as this costs are not covered by health insurance (Bracknies, 2021). The question remains, how many children in Europe are in the need of myopia management. Analyzing the sales from 400 opticians in Germany between the years 2000 to 2021 indicated that, only a fraction of these children would have benefited from a management of myopia.
The worldwide prevalence, as well as the increase in the progression of myopia, is a global challenge that requires local considerations. But: findings on the refractive development of the juvenile eye in eyes of Asian ethnicity cannot be transferred 1:1 to European children and there is no need for eye care professionals in Europe to panic. Nevertheless, myopia management is a useful additional service provided by eye care professionals in order to keep children eyes healthy, focusing to providing the best possible care for children to allow a healthy development. This does not mean to stop the growth of the, but rather to reduce the myopic growth to a physiologically normal level. Myopia management in the practice can be supported by percentile curves as described in the article, which are based on scientific data, providing and additional tool for the practitioner to make the right decision at the right time. Moreover, a ZEISS guideline for the management of myopia is also available. When transferring scientific and clinical knowledge into practice, additional points are needed to be considered – some of which can be controlled by the eye care professionals themselves (myopia management workflow / SOP, for instance) – whereas external factors (legal situation, costs) are mostly unchangeable. Nevertheless, the influence of these factors can be reduced in order to bring benefits to the individual child, e.g. by partnering with other eye care professionals or be adaptation of the pricing.

-
1
Bracknies, A.-K. (2021). Entwicklung und Implementierung eines Myopiepräventionskonzeptes mit Ermittlung der Kostenakzeptanz bei den Eltern.
-
2
Cao, K., Wan, Y., Yusufu, M., & Wang, N. (2020). Significance of Outdoor Time for Myopia Prevention: A Systematic Review and Meta-Analysis Based on Randomized Controlled Trials. Ophthalmic Research, 63(2), 97–105. https://doi.org/10.1159/000501937
-
3
Fledelius, H. C. (1992). Pre-term delivery and the growth of the eye An oculometric study of eye size around term-time. Acta Ophthalmologica, 70(S204), 10–15. https://doi.org/https://doi.org/10.1111/j.1755-3768.1992.tb04915.x
-
4
Flitcroft, D. I. (2012). The complex interactions of retinal, optical and environmental factors in myopia aetiology. Progress in Retinal and Eye Research, 31(6), 622–660. https://doi.org/10.1016/j.preteyeres.2012.06.004
-
5
Gifford, K. L., Richdale, K., Kang, P., Aller, T. A., Lam, C. S., Liu, Y. M., Michaud, L., Mulder, J., Orr, J. B., Rose, K. A., Saunders, K. J., Seidel, D., Tideman, J. W. L., & Sankaridurg, P. (2019). IMI – Clinical Management Guidelines Report. Investigative Ophthalmology & Visual Science, 60(3), M184–M203. https://doi.org/10.1167/iovs.18-25977
-
6
Holden, B. A., Fricke, T. R., Wilson, D. A., Jong, M., Naidoo, K. S., Sankaridurg, P., Wong, T. Y., Naduvilath, T. J., & Resnikoff, S. (2016). Global Prevalence of Myopia and High Myopia and Temporal Trends from 2000 through 2050. Ophthalmology, 123(5), 1036–1042. https://doi.org/10.1016/j.ophtha.2016.01.006
-
7
Sankaridurg, P., Tahhan, N., Kandel, H., Naduvilath, T., Zou, H., Frick, K. D., Marmamula, S., Friedman, D. S., Lamoureux, E., & Keeffe, J. (2021). IMI impact of myopia. Investigative Ophthalmology & Visual Science, 62(5), 2.
-
8
Sherwin, J. C., Reacher, M. H., Keogh, R. H., Khawaja, A. P., MacKey, D. A., & Foster, P. J. (2012). The association between time spent outdoors and myopia in children and adolescents: A systematic review and meta-analysis. Ophthalmology, 119(10), 2141–2151. https://doi.org/10.1016/j.ophtha.2012.04.020
-
9
Truckenbrod, C., Meigen, C., Brandt, M., Vogel, M., Sanz Diez, P., Wahl, S., Jurkutat, A., & Kiess, W. (2021). Longitudinal analysis of axial length growth in a German cohort of healthy children and adolescents. Ophthalmic and Physiological Optics, 41(3), 532–540. https://doi.org/https://doi.org/10.1111/opo.12817
-
10
Truckenbrod, C., Meigen, C., Brandt, M., Vogel, M., Wahl, S., Jurkutat, A., & Kiess, W. (2020). Reference curves for refraction in a German cohort of healthy children and adolescents. PLOS ONE, 15(3), e0230291. https://doi.org/10.1371/journal.pone.0230291