Capturing the Whole Organoid in a Single Shot
Volumetric drug-response screening of 3D tumor organoids in 384-well format with ZEISS Lightfield 4DBy Peter Favreau, ZEISS Microscopy
9 Min Read | June 2026
Three-dimensional (3D) in vitro models such as organoids capture tumor architecture, cell–cell interactions, and drug penetration far better than flat 2D monolayers, but turning that biology into quantitative data at screening scale has remained a bottleneck. Conventional confocal imaging reconstructs each organoid from a serial stack of optical sections, and across a multiwell plate that adds up quickly. This application note shows how the ZEISS LSM 990 with Lightfield 4D captures the entire volume of an organoid in a single snapshot, without the need for imaging sequential optical sections, making quantitative drug-response screening practical in a 384-well plate. Colorectal tumor organoids treated with the topoisomerase inhibitor SN-38 showed a clear dose-dependent loss of tumor cells (roughly 57% at the highest dose), and analyzing the full 3D volume recovered about 2 – 2.5 times more cells than a 2D projection of the very same data.


The 3D screening bottleneck
Organoids and other 3D models are now central to drug discovery and toxicology because they recapitulate in vivo tissue organization in ways that monolayer cultures cannot. Running these models at scale, however, places three competing demands on the imaging step: enough speed to image many organoids for statistical power, enough reproducibility in both organoid formation and measured response to trust the numbers, and response metrics that capture the full 3D biology rather than a flattened proxy of it.
Imaging is where those demands collide. Acquiring the complete 3D morphology of every organoid by serial optical sectioning can be prohibitively slow across a full plate. Collapsing each organoid to a single 2D plane is fast but discards the morphology that motivated the 3D model in the first place. A common compromise is sampling a thin slab through the organoid, yet this can be misleading when organoids are irregular or heterogeneous, as is often the case with patient-derived samples. The screening question thus becomes how to keep the full volume without paying the full acquisition cost.
One snap. One volume.
Spinning-disk confocal microscopy is the workhorse for volumetric organoid imaging, but it still acquires a volume the slow way: plane by plane, typically twenty to forty sections to span a single 150–250 µm organoid. The ZEISS LSM 990 with Lightfield 4D takes a different route. It records multiple angular views of the sample at once and computationally reconstructs a complete volume from that single acquisition. In other words, one snapshot, one volume, with no z-stepping (Figure 1).


Figure 1: The Lightfield 4D principle. Multiple lens views are captured simultaneously, each encoding distinct spatial and angular information; deconvolution-based processing reconstructs a volume that can be handled and analyzed like a conventional z-stack.


Removing the z-stack changes the throughput equation, because per-well acquisition time is then governed by exposure alone rather than multiplied by the number of slices. For context, a spinning-disk acquisition of a comparable organoid might take several seconds per well, whereas a single Lightfield 4D snapshot captures the same volume in a fraction of that time.
Just as useful for screening is that Lightfield 4D and Airyscan live on the same LSM 990 platform. That makes a two-tier, screen-then-interrogate workflow possible: image the whole plate rapidly with Lightfield 4D, then revisit the wells that stand out at higher resolution with Airyscan. No instrument change necessary, no sample transfer, and no sample re-registration.
From plate to 3D readout
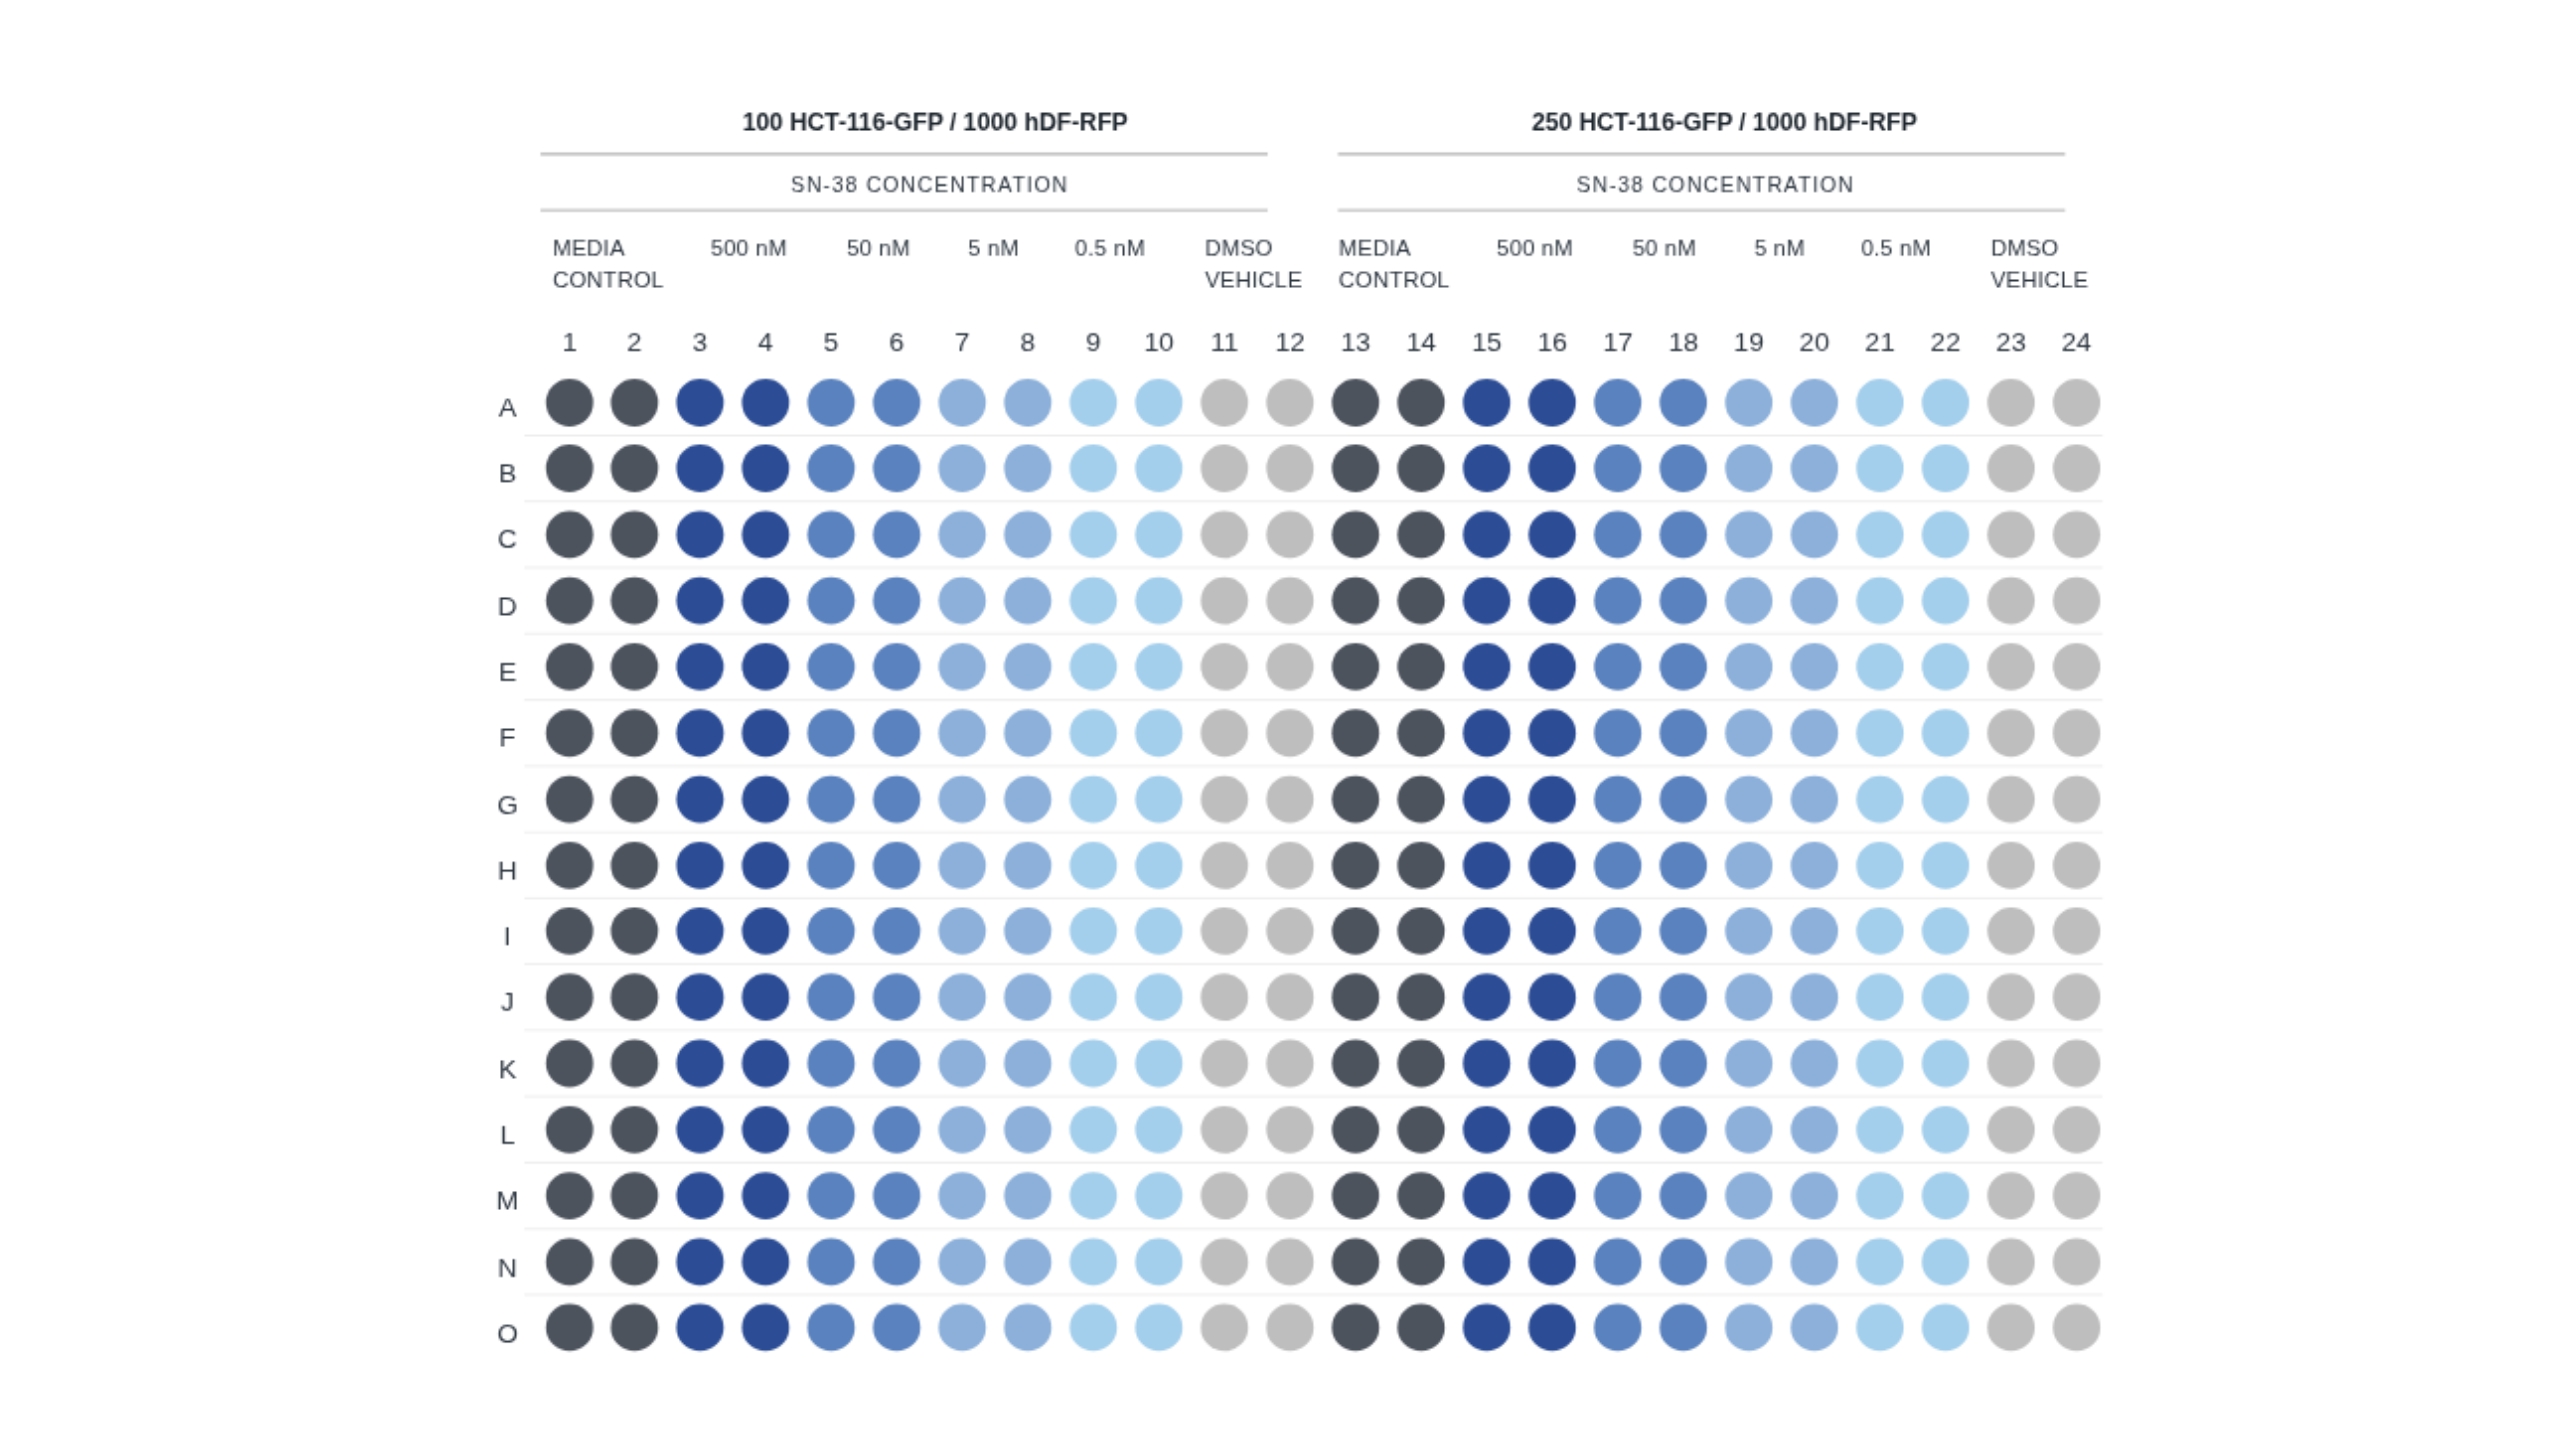
In this study, the organoids were grown by pairing green fluorescent protein (GFP)-labeled HCT-116 human colorectal carcinoma cells with red fluorescent protein (RFP)-labeled human dermal fibroblasts (hDFs) as a tumor–stroma co-culture. These cell types were grown at two seeding densities in InSphero Akura™ 384 ImagePro multiwell plates. Organoids were cleared and counterstained with the nuclear dye DAPI. On day four, they were treated with the highly potent anti-neoplastic drug SN-38. SN-38 was administered across four concentrations from 0.5 nM to 500 nM, alongside dimethyl sulfoxide (DMSO) vehicle controls and untreated media controls (Figure 2).


The acquisition itself followed a simple survey-then-image logic (Figure 3): a low-magnification overview scan first confirms which wells contain organoids and where they sit; flagged wells are then imaged volumetrically with Lightfield 4D in three fluorescence channels; and any wells of particular interest are re-imaged with Airyscan on the same instrument for higher-resolution detail.


Figure 3: Organoid screening workflow with ZEISS Lightfield 4D. A low-magnification survey locates organoids; selected wells are imaged with Lightfield 4D; noteworthy wells are interrogated with Airyscan on the same LSM 990; and data are collated and analyzed in ZEISS arivis Pro.


Quantification was performed in ZEISS arivis Pro. A U-Net deep-learning model first segmented each organoid from its well, after which cells were detected per channel and scored only if they fell inside the segmented 3D organoid. The 3D analysis yielded per-well cell counts, compartment volumes, and fluorescence intensities. Of the 384 wells, 322 were successfully analyzed; the roughly 20% loss occurred during clearing, washing, and handling rather than imaging.
Video walkthrough of the organoid screening workflow
Response to treatment
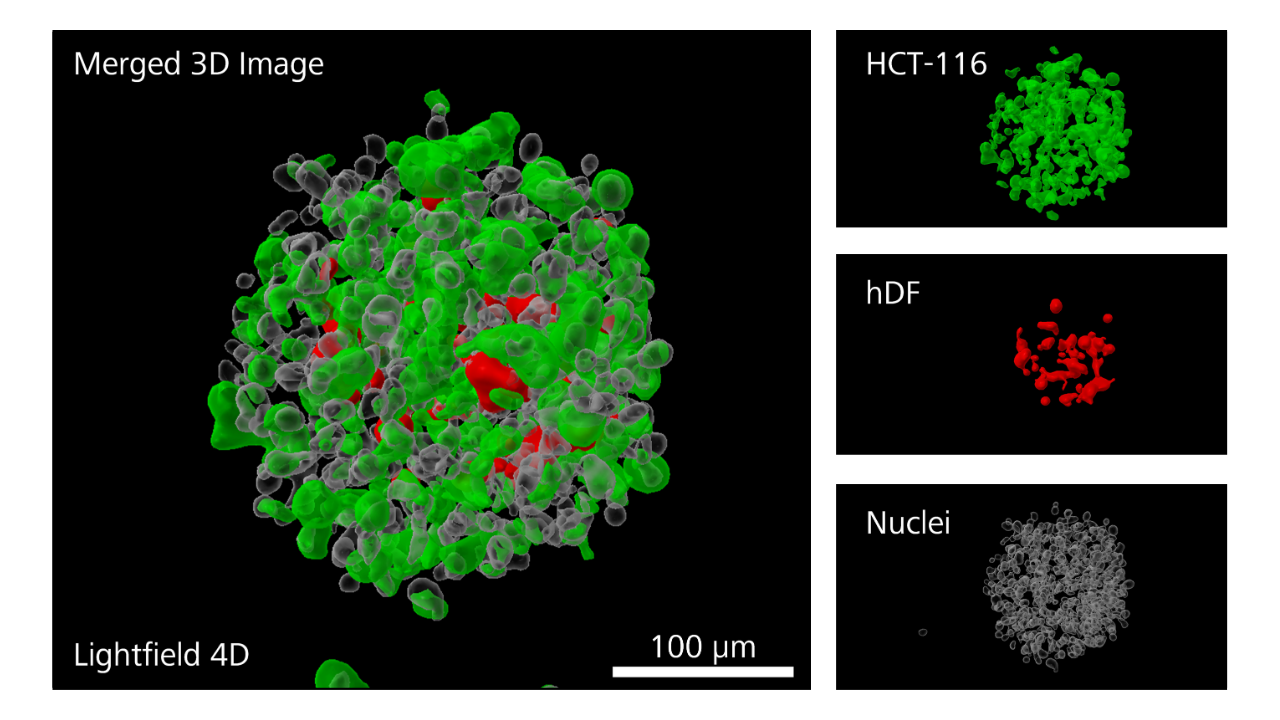
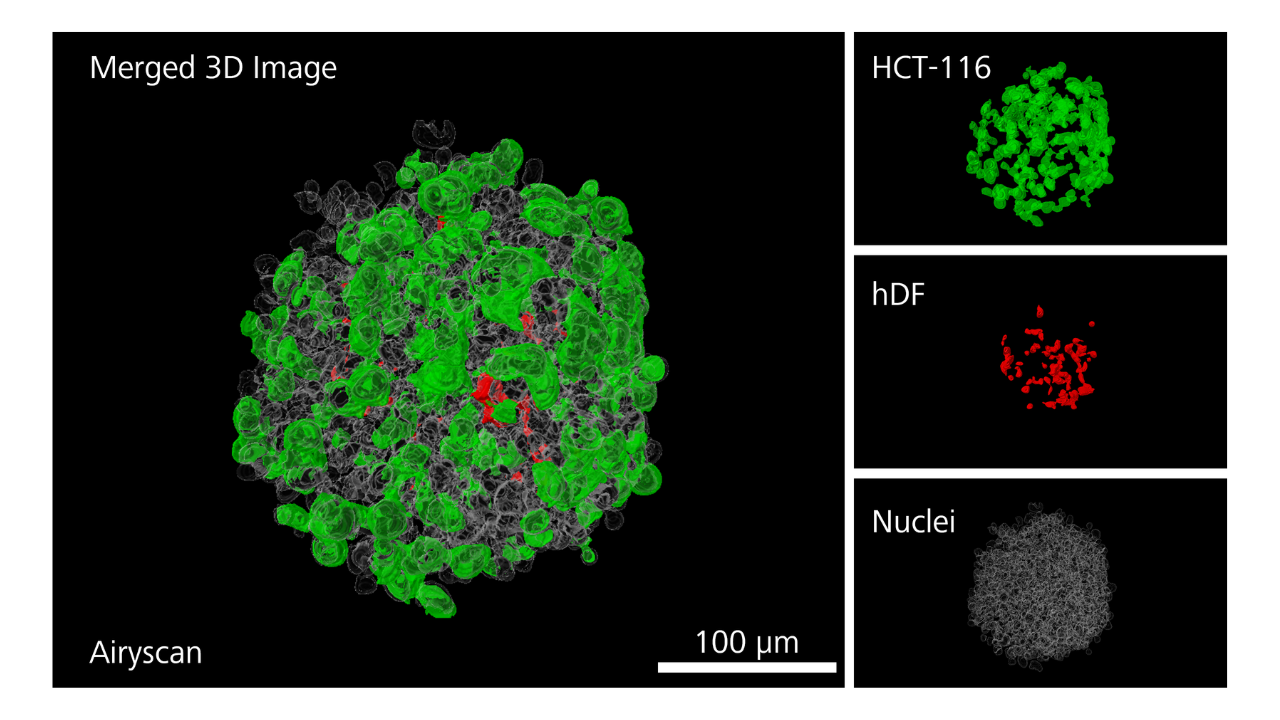
A representative control well imaged with Lightfield 4D, then segmented in arivis Pro, is shown in Figure 4; the identical field of view re-imaged with Airyscan (Figure 5) illustrates the higher-resolution detail available without leaving the platform.


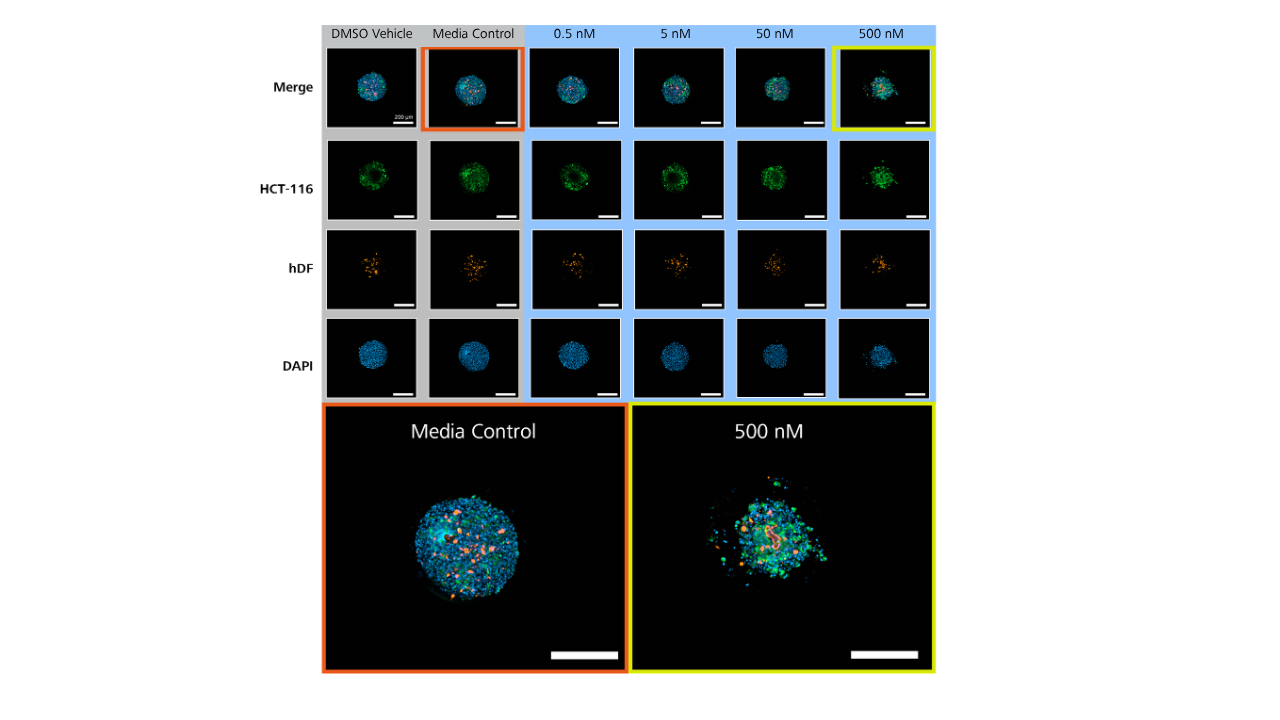
Across the dose series, organoid structure progressively lost cohesion with increasing SN-38 concentration (Figure 6). Increasing concentration of SN-38 also resulted in fewer GFP-positive cells.. GFP-positive cells declined steadily from 0.5 nM through 500 nM, with the two highest doses producing the most pronounced effect (Figure 7). At 500 nM, GFP-positive tumor-cell count was reduced by approximately 57% relative to the media control. Drug response was comparable at both seeding densities.


Seeing the whole picture


Conclusion


Taken together, these results indicate that volumetric organoid imaging is practical at screening scale, and that 3D-resolved metrics give a more complete picture of drug response than conventional 2D approaches.
Acknowledgements
This work was carried out in collaboration with InSphero AG, whose Akura™ 384 ImagePro platform and reproducible tumor–stroma organoid co-cultures formed the biological basis of the study.


ZEISS Microscopy