Skip to main content

Reveal subtle differences in electrostatic potential and material composition at ultra-low voltages even below 200V. Characterize charging behavior and near-surface structures in advanced materials and semiconductor samples.
Advanced materials and semiconductor samples require imaging at very low landing energies to reveal meaningful electrical and material differences. Conventional imaging approaches can make it difficult to distinguish subtle variations in electrostatic potential, charging behavior, and near-surface features.
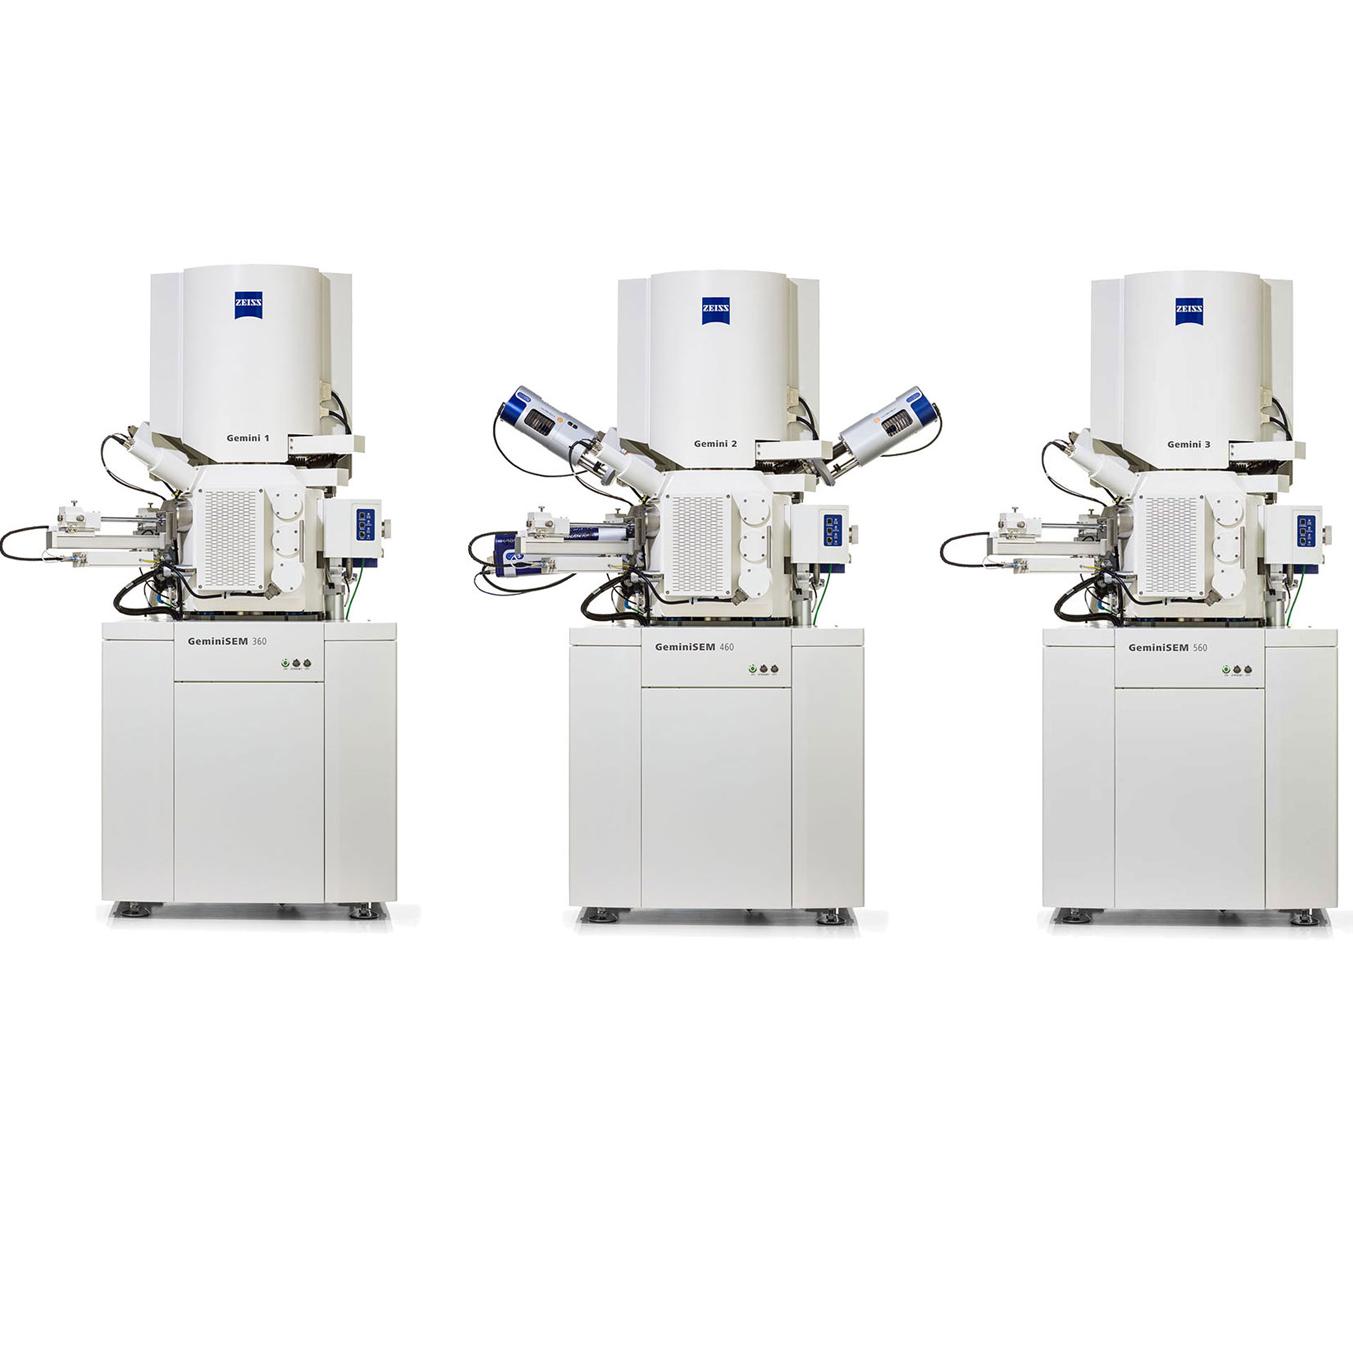
The ultra-low voltage (ULV) detector on ZEISS GeminiSEM enables voltage contrast imaging at voltages even below 200 V. ULV is helping researchers and engineers uncover information beyond topography and composition. Whether working in failure analysis, semiconductor development, or advanced materials research, users can efficiently characterize sensitive samples with confidence.
Obtain clearer images with lower signal-to-noise and a higher resolution of 1 nm at 200 V due to improved detector sensitivity.
Find local surface potentials. Separate phases in complex samples. Get excellent results for segmentation and analysis.
Capture information on differences in voltage or doping in one workflow, revealing features beyond conventional in-column detection.


Battery sample, graphite anode with two binders. Passive voltage contrast imaging with the ULV detector, combined with topography from the Inlens detector and material contrast from the EsB detector, reveals binder-related phases and subtle material differences. The three detector signals provide complementary topographical, material, and voltage information in a single acquisition, enabling segmentation and phase analysis for battery research. GeminiSEM, 100 eV, WD 2 mm, Inlens (left), ULV (center), EsB (right).


SRAM device featuring passive voltage contrast imaging of vias and transistor-related structures. The ULV detector reveals subtle electrical and voltage-related differences that are less apparent with conventional imaging alone, improving the visibility of vias, contacts, and device features. Combined with Inlens imaging, the complementary signals support connectivity checks, semiconductor failure analysis, and advanced device characterization in a single workflow.


Silicon doping calibration standard featuring N- and P-doped regions. The ULV detector enables clear differentiation of doping levels at ultra-low voltages, revealing variations in semiconductor doping that are not discernible with conventional Inlens imaging under the same conditions. By enhancing voltage contrast at low landing energies, the ULV detector supports semiconductor device characterization, doping analysis, and failure analysis workflows.


This technology note explains why ultra-low-voltage SEM matters. You will discover:
ZEISS service and application support help you adopt advanced field emission scanning electron microscopy with confidence. From onboarding and training to technical support and service plans, ZEISS helps users get value from the system across daily operation, shared lab environments, and evolving application needs.
Ultra-low-kV SEM uses landing energies of 500 V or less. The reduced interaction volume emphasizes surface structures while minimizing beam interaction with the sample, making this approach valuable for polymers, thin layers, organic materials and other sensitive samples.
At short working distances, in-column detection, also called Inlens, primarily captures medium-energy secondary electrons to visualize morphology and topography. The ULV detector efficiently detects low-energy secondary electrons, while the Inlens EsB detector provides complementary compositional information.
Yes. Gold nanoparticles remain resolved at a landing energy of 200 V, demonstrating 1.0 nm high-resolution SEM performance even under ultra-low-kV conditions.
In a graphite anode containing the battery binders SBR (styrene-butadiene rubber) and CMC (carboxymethyl cellulose) battery binders, ULV imaging makes binder-related phases appear dark against the graphite. This contrast can support segmentation and quantitative phase analysis.
At 200 V, ULV imaging reveals a gray ionomer alongside bright catalyst particles in a fuel-cell polymer membrane electrode assembly (MEA). It can also detect signals from membrane regions deeper within pores.
Passive voltage contrast occurs when areas at different electrostatic potentials alter the yield and energy of escaping secondary electrons. This effect allows electrically distinct semiconductor structures, such as connected vias in SRAM (static random-access memory) devices, to produce visible contrast for quality control.
Doping contrast occurs when differences in surface potential alter the effective escape barrier for low-energy secondary electrons. Regions with different doping profiles therefore produce different secondary-electron yields.
Yes. Local charging can create voltage and material contrast between conductive and non-conductive phases. For example, in ceramic composites, ULV imaging can reveal non-conductive sintering agents that are difficult to distinguish with conventional Inlens imaging.
Local surface potential shifts the secondary-electron energy spectrum. Low-energy electrons are especially sensitive to these changes, creating strong contrast between conductive and non-conductive materials.
ULV imaging adds material contrast to morphology-focused Inlens images. In boron-doped steel, boron oxide deposits appear dark while grain-boundary precipitates appear bright. ULV imaging can also support steel inclusion analysis.
Applications include battery coatings and binders, fuel-cell membranes, composites with conductive and non-conductive phases, thin films, ceramics, semiconductor devices, polymers and two-dimensional materials.
Key benefits include greater sensitivity to low-energy secondary electrons, enhanced voltage and material contrast, improved resolution at ultra-low voltages and richer image data for segmentation and quantitative analysis.