

ZEISS Dynamics Profiler Your Easy Access to Underlying Molecular Dynamics in Living Samples
Uncover molecular concentration, asymmetric diffusion, and flow dynamics of fluorescent proteins in your living samples in a single, easy measurement. Develop a more in-depth profile of the molecules in your current experiments, from cell cultures to organoids to whole organisms.
Add a New Dimension to Live Imaging
See ZEISS Dynamics Profiler in Action

Remarkably Easy Access to Molecular Dynamics
Wizard-Guided Measurements with Built-in Quality ControlMolecular dynamics experiments are often limited by lack of equipment or the necessary highly trained personnel. Now, with the Dynamics Profiler function that can be easily added to a ZEISS confocal with the Airyscan detector, any proficient confocal microscopy user can go beyond traditional confocal imaging to collect molecular concentration and dynamics information about a protein of interest. The wizard-guided workflow ensures precise acquisition settings and simple data quality control. Reference images aid in sample context and measurement position documentation. Comprehensible data visualization enables intuitive access to the information obtained.


New Insights from Your Living Samples
Add Dynamics Measurements to Your Current ExperimentsPreviously, confocal users applied techniques like Fluorescence Recovery after Photobleaching (FRAP) to measure molecular dynamics despite limitations, including that each sample can be measured only once and phototoxic levels of light exposure. Traditional Fluorescence Correlation Spectroscopy (FCS) could be used to precisely measure fluorescent protein concentrations, but required additional equipment and could be challenging, even to experienced users. Dynamics Profiler is the first tool with an intuitive and easy-to-use interface to provide effortless access to these data simultaneously during confocal imaging experiments with low time and light investment. Developed from FCS, it uniquely allows these measurements even in bright and challenging samples.


Access to New Molecular Discoveries
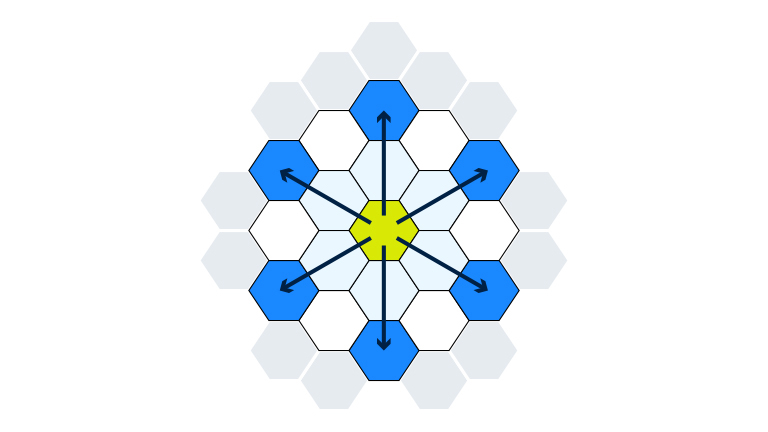
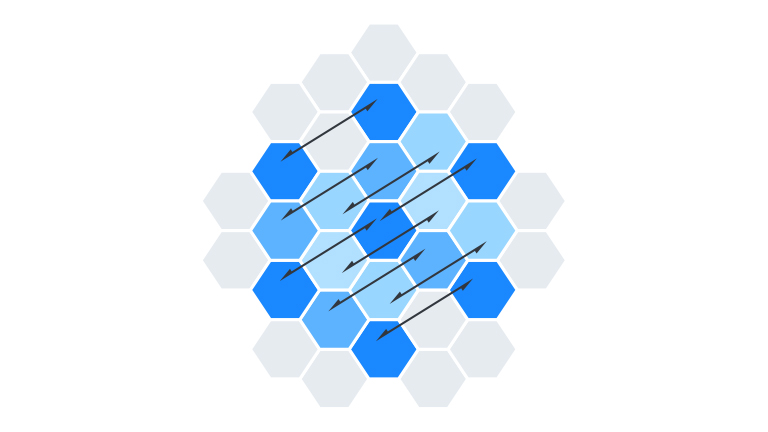
Spatial Correlative Information Provides Asymmetric Diffusion and Flow AnalysesWith traditional FCS, molecular measurements are limited to a single excitation volume. By utilizing the Airyscan area detector, Dynamics Profiler adds spatial information, enabling new, in-depth molecular profile analyses in single measurements. The Asymmetric Diffusion Tool can capture asymmetric diffusion behavior within a single point spread function, such as at the interface of the liquid-liquid phase separation leading to cellular condensates. The Flow Analysis Tool measures the speed and direction of fluorescent molecules all within a single excitation volume – perfect for the measurement of active movement of solutions, such as biological processes in the blood stream, or in microfluidic systems, such as organs-on-a-chip. The raw data from each measurement is available for further, customized analyses.


Technology Insights
Airyscan enables FCS investigations of brighter samples and adds new spatial information.Fluorescence Correlation Spectroscopy (FCS) is an established method to investigate molecular characteristics. While a precise and very sensitive method, traditionally it is limited to extremely low expression levels or molecule concentrations that can be well below the experimental expression levels in live research samples.
ZEISS Airyscan uniquely employs all its detector elements to collect 32 individual FCS intensity traces per measurement. The mean value of the inner 19 elements provides robust and reliable measurements on molecular concentration and dynamics, even for bright samples. Moreover, the area detector allows a variety of spatial cross-correlation analyses by using combinations of single detector elements.


ZEISS Dynamics Profiler at Work
Application Examples of Molecular Dynamics Measurements

Application Examples of Molecular Dynamics Measurements
Sample courtesy of Prof. Dr. Achim Paululat and Dr. Christian Meyer, Osnabrück University, Department of Zoology and Developmental Biology, Germany
Sample courtesy of Prof. Dr. Achim Paululat and Dr. Christian Meyer, Osnabrück University, Department of Zoology and Developmental Biology, Germany
Compare Concentrations of Molecules in Different Cells
Fluorescent protein dynamics and concentration measurements can effortless be added to a confocal experiment. The sample shows a Drosophila melanogaster embryo expressing mCherry under control of the hand cardiac and hematopoietic enhancer (Han and Olson, 2005), located in the third intron. The expression of the reporter mimics endogenous hand expression in the heart and is maintained throughout embryogenesis in cardioblasts as well as in pericardial cells. Even with bright samples like this, Dynamics Profiler allows to get robust FCS data and compare concentrations of molecules in different cells.
Conventional fluorescence overview image (left) and z stacks (middle); subsequent Dynamics Profiler measurements within the same embryo at the same system (right). Graph and data table show measurement results from five different spots.


Determine Dynamic Changes at the Border of Nucleoli
Samples kindly provided by P. Hemmerich and T. Ulbricht (Core Facility Imaging, Leibniz Institute on Aging, Jena, Germany).
Samples kindly provided by P. Hemmerich and T. Ulbricht (Core Facility Imaging, Leibniz Institute on Aging, Jena, Germany).
Determine Dynamic Changes at the Border of Nucleoli
Live U-2 OS cells transiently co-expressing tetrameric EGFP and the nucleolar protein Fibrillarin tagged with monomeric Red Fluorescent Protein were subjected to Dynamics Profiler measurements at the border of the nucleoli as indicated in the confocal overview image.
Polar heatmaps: Asymmetric Diffusion measurement within spot 1 (top row) and spot 2 (bottom row). Molecular dynamics of EGFP at the nucleolar border were determined.
Graphs: Asymmetric Diffusion measurement by pair correlation of inner Airyscan elements along six angles within spot 1 (left) and spot 2 (right)


Measure the Flow Speed in Blood Vessels of Zebrafish Larvae
Courtesy of V. Hopfenmüller, Leibniz Institute on Aging – Fritz Lipmann Institute (FLI), Germany
Courtesy of V. Hopfenmüller, Leibniz Institute on Aging – Fritz Lipmann Institute (FLI), Germany
Measure the Flow Speed in Blood Vessels of Zebrafish Larvae
The spatial information provided by the Airyscan detector allows analyses to determine the flow speed of molecules in the blood. Tetramethylrhodamine-labeled Dextran (10 kDa, Dynamics Profiler measurement) and Fluorescein-labeled Dextran (40 kDa, labeling blood vessels) were injected into blood vessels of a 5-day-old zebrafish larvae that was embedded in 1% low melt agarose.
Reference image and Dynamics Profiler data acquired with LSM 980 with Airyscan 2. Direction and speed of molecule flow through the blood vessel were measured at two different spots. The graphs (right) show the correlation curves of the measurement within spot 1: correlation curves of selected angles (top), actual flow speed and direction results out of the 6 cross-correlations along three axis (bottom).


Cybersecurity at ZEISS Microscopy
As digitalization advances in microscopy, so do the complexities of cybersecurity. ZEISS Microscopy is committed to proactively securing our technologies and protecting our customers. Our Cybersecurity and Data Privacy Governance Program goes beyond traditional security—it also encompasses Responsible AI and Open Source Software (FOSS) governance.


