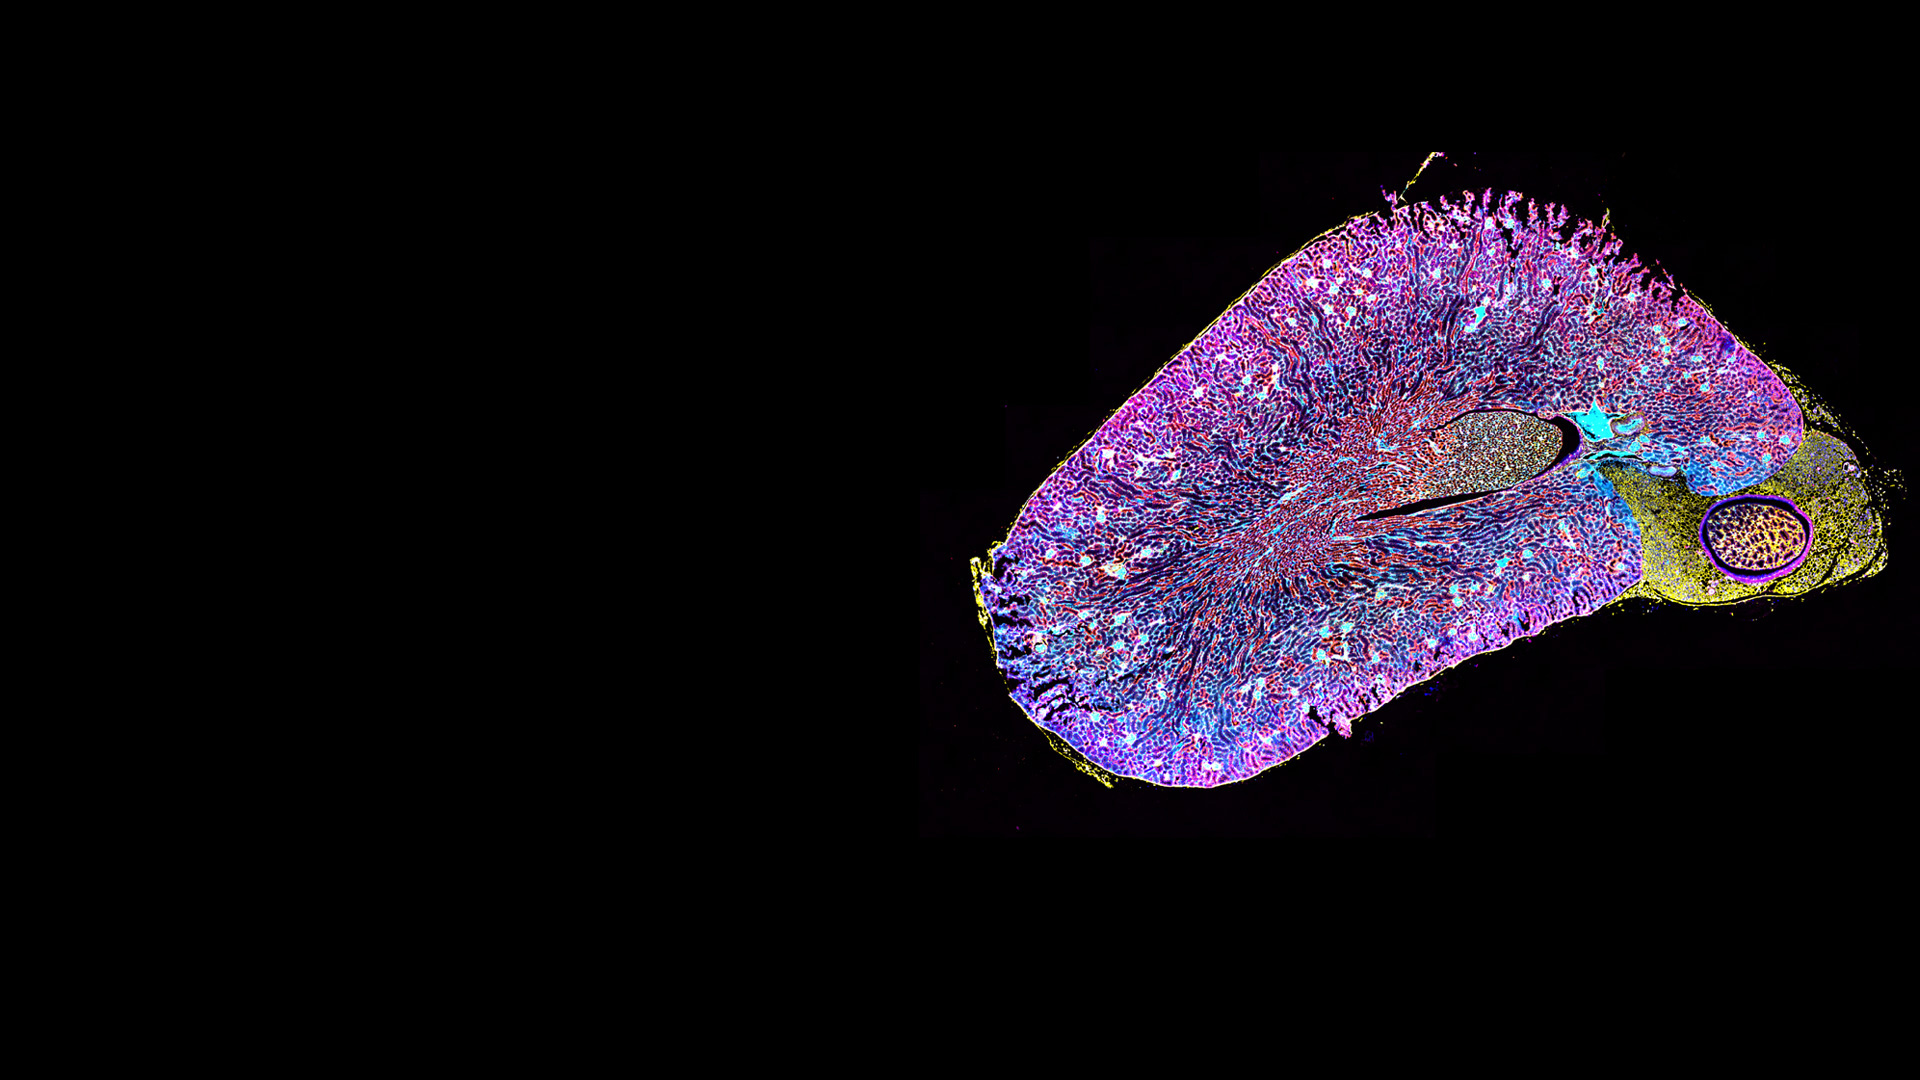

Spatial biology simplified
From complexity to clarity: workflow automation at scaleTurn complexity into clarity and enhance your research capabilities. ZEISS solutions for spatial biology facilitate the seamless integration of spatial profiling into your workflows, ensuring efficient and consistent multiplexed spatial profiling at scale. We accelerate research to better insights and transform the understanding of cellular systems to revolutionize pathology.
Unlock the power of spatial biology
Spatial biology enables detailed analysis of cell presence, abundance, spatial distribution, and cell-to-cell interactions within the native tissue microenvironment. By leveraging multiplex immunofluorescence (mIF) staining with multiple biomarkers, it goes beyond traditional methods, allowing simultaneous visualization and quantification of numerous proteins within a single tissue section.
This powerful approach provides in-depth insights into complex biological processes, such as immune cell infiltration in tumors, pathogen-host interactions, inflammatory responses, metabolic dysregulation, and neuroimmune communication. Spatial biology is driving innovation across fields like immuno-oncology, infectious disease research, neurology, metabolic and cardiovascular health, and regenerative medicine, paving the way for more precise and predictive diagnostics.
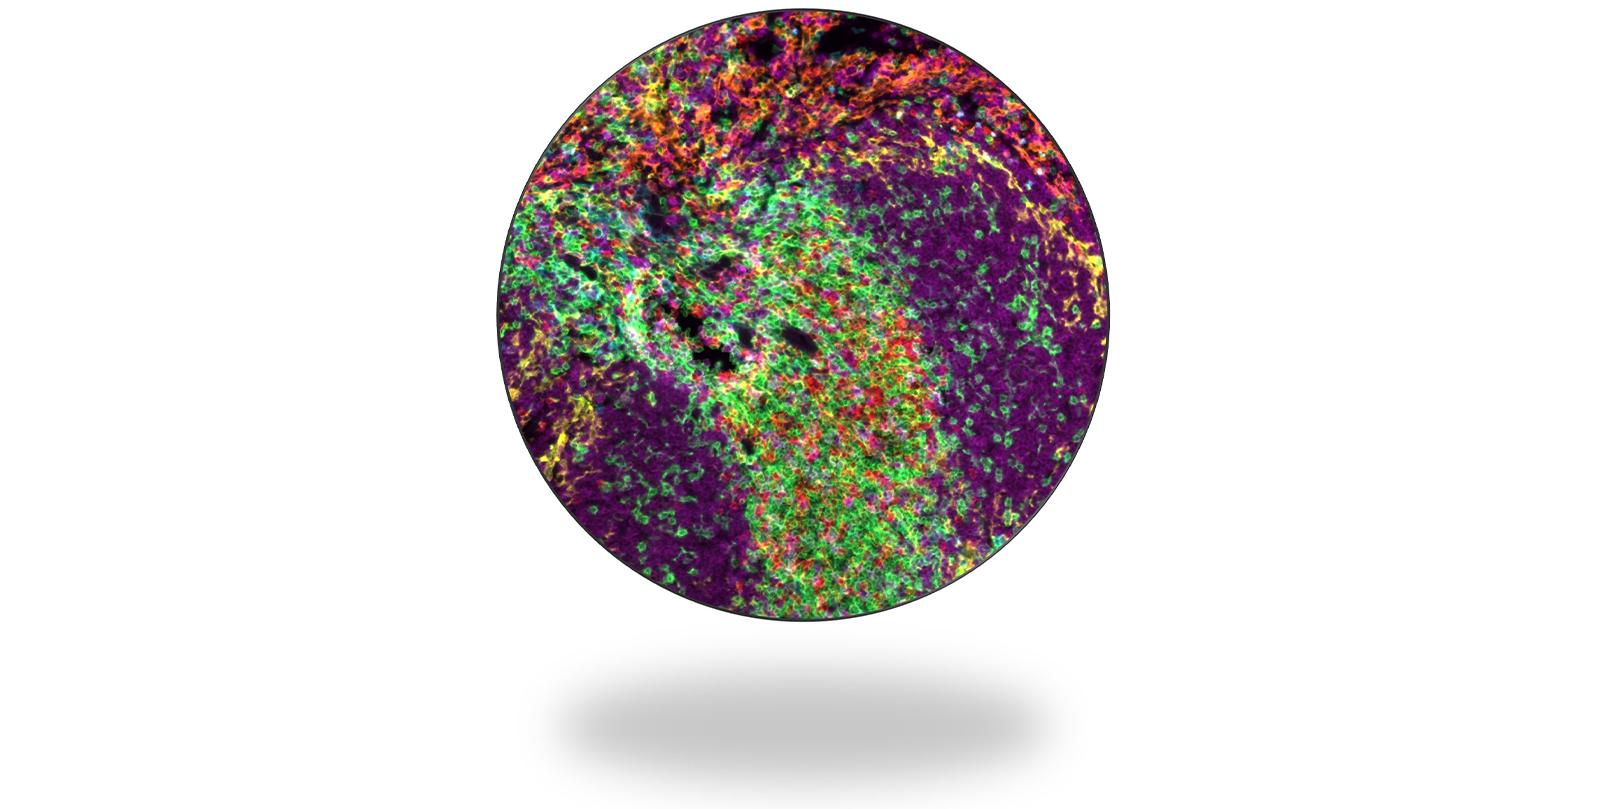

Enabling efficient, reproducible multiplex spatial profiling at scale
Are you a translational, immuno-oncology researcher or service laboratory looking for a comprehensive solution that enables you to work at high throughput while ensuring accurate and reproducible data? The ZEISS tissue multiplexing workflow for biopharma, Academic Medical Centers and CROs enables routine histopathology laboratories with no prior experience of spatial biology methods to deliver rich biomarker data with high consistency across large cohorts.
Benefit from the efficiency of this tissue multiplexing workflow in your large cohorts, even under tight deadlines. Standardized methods allow you to conduct multi-site clinical trials with consistency over time, ensuring reproducible and consistent results. In addition, our solution streamlines data analysis and reporting, making it easier to evaluate multiple parameters and gain actionable insights.


Seamless sample-to-report experience with our streamlined spatial biology workflow
With our ZEISS Spatial Biology offering, we simplify high-throughput multiplex IF imaging and analysis making it robust, scalable, and accessible. Our seamless tissue multiplexing workflow aims to empower routine histopathology labs, including those with no prior spatial biology expertise, to generate comprehensive, reproducible biomarker data across large sample cohorts. By combining automation, optimized imaging, and AI-powered analysis, we pave the way for the translational adoption of spatial proteomics and the transition to clinical practice.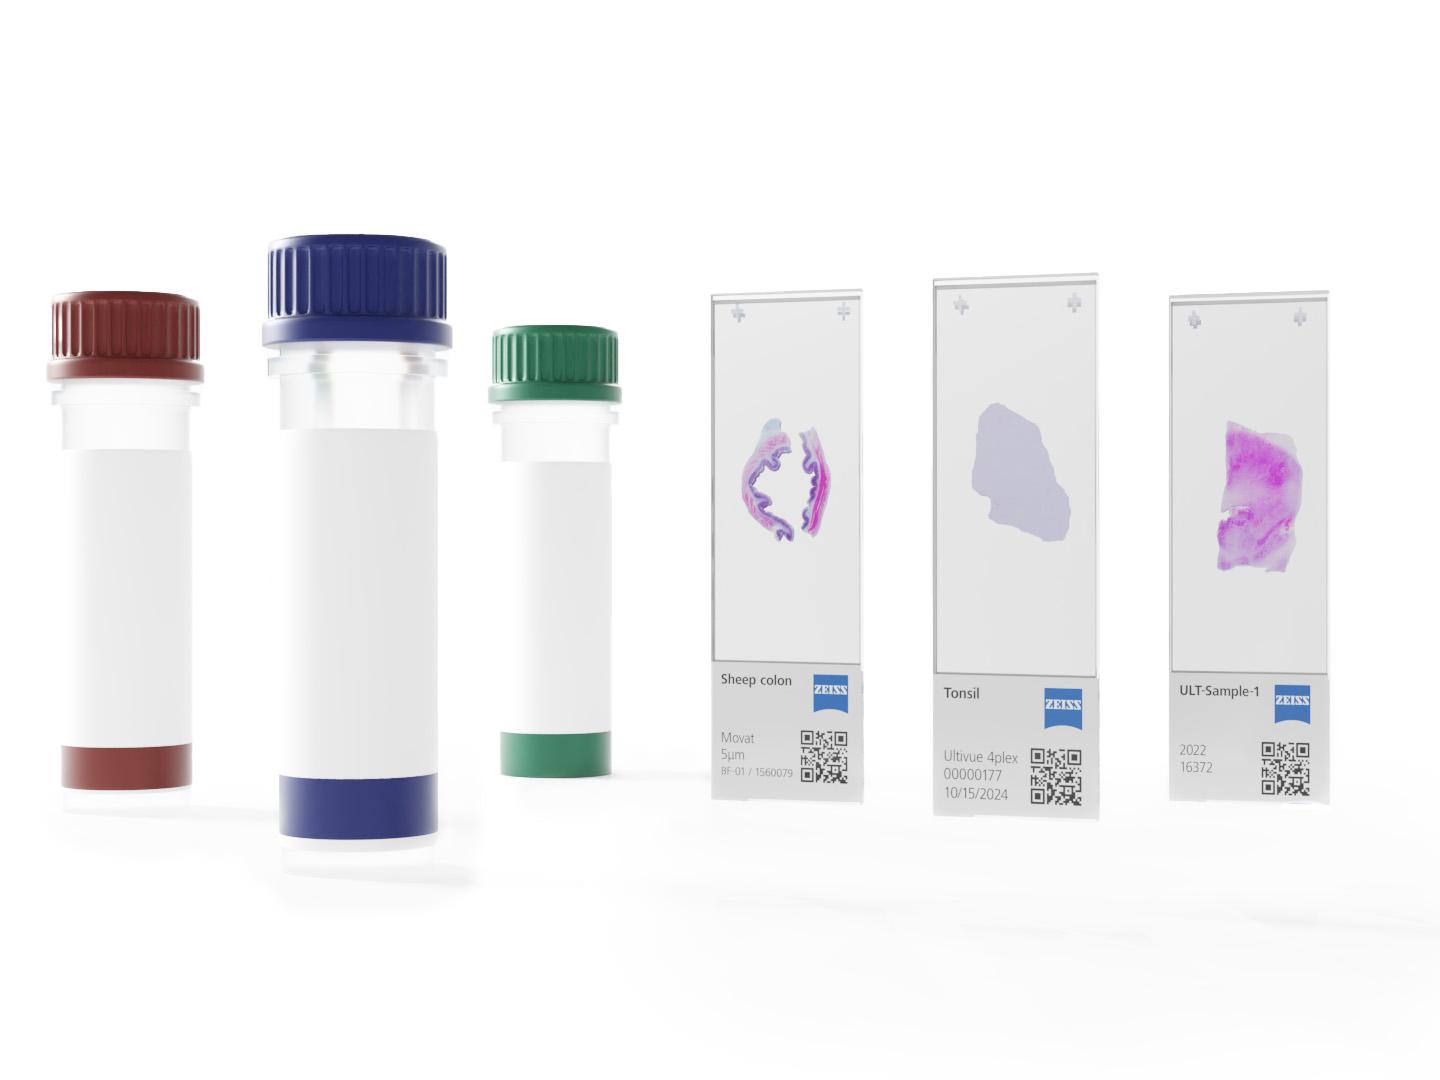

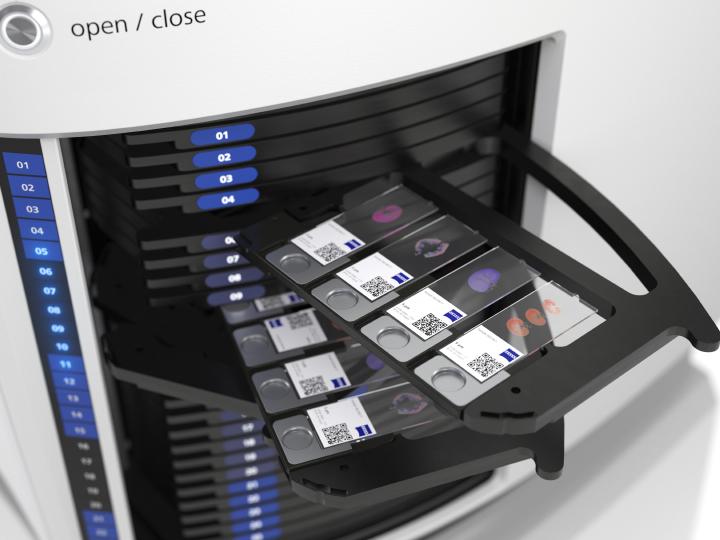






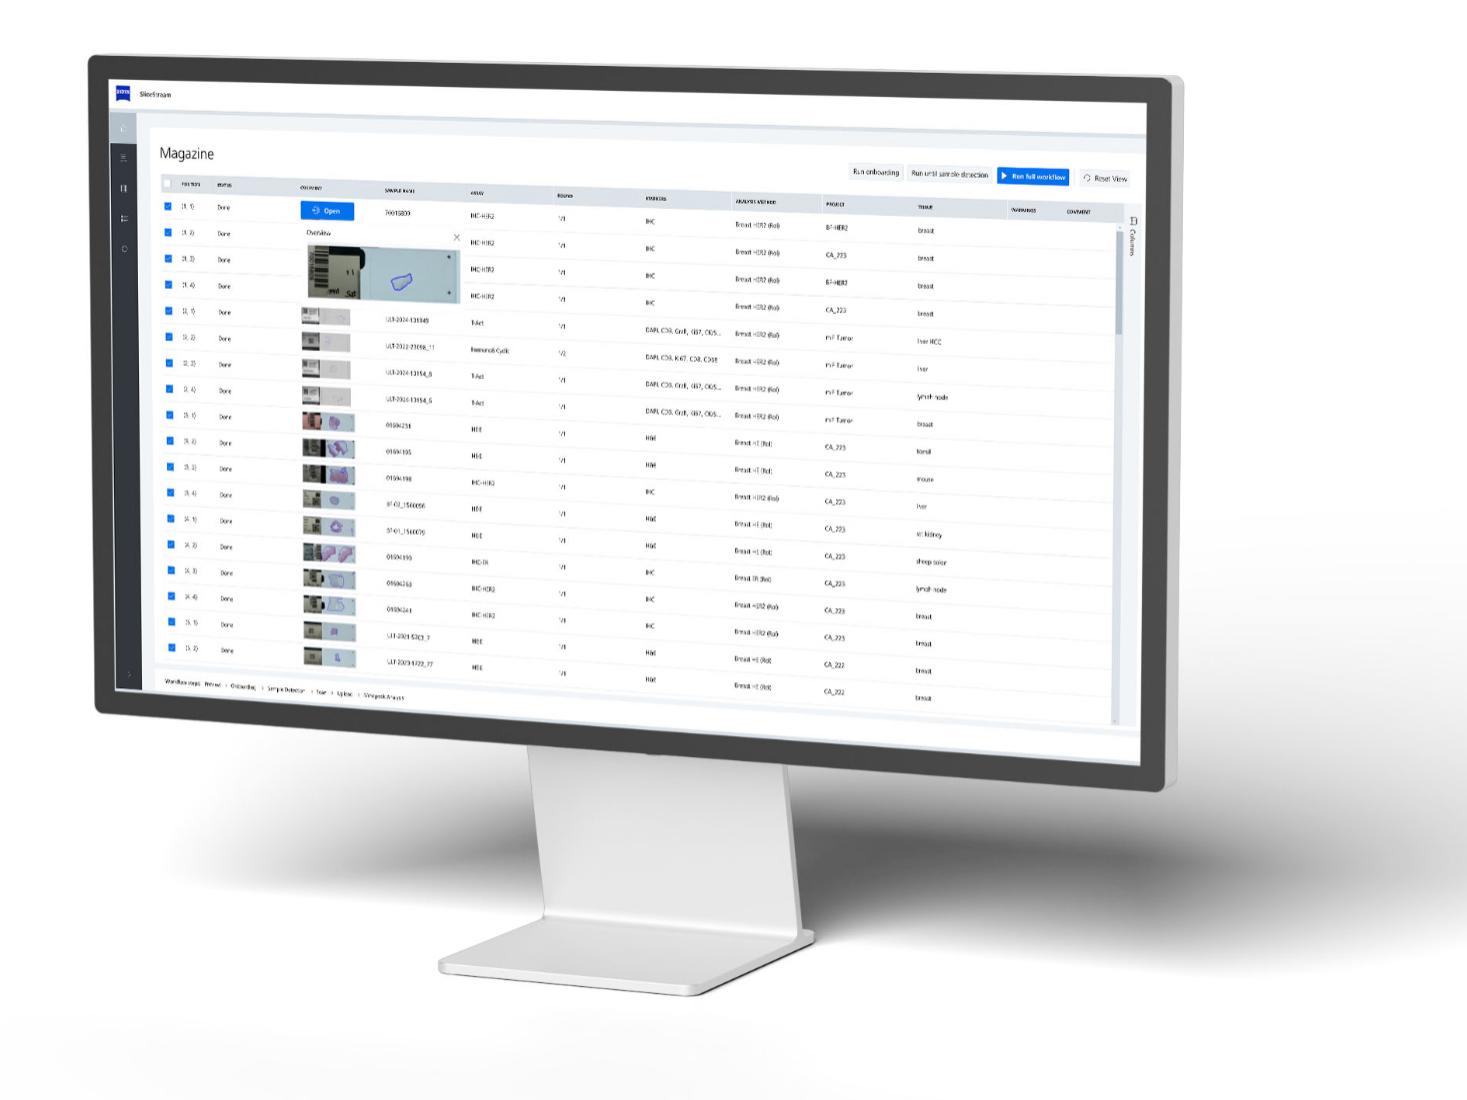
Workflow automation for spatial biology
From login to scanning in few minutes, no microscopy expertise required



Phenoscout by Mindpeak
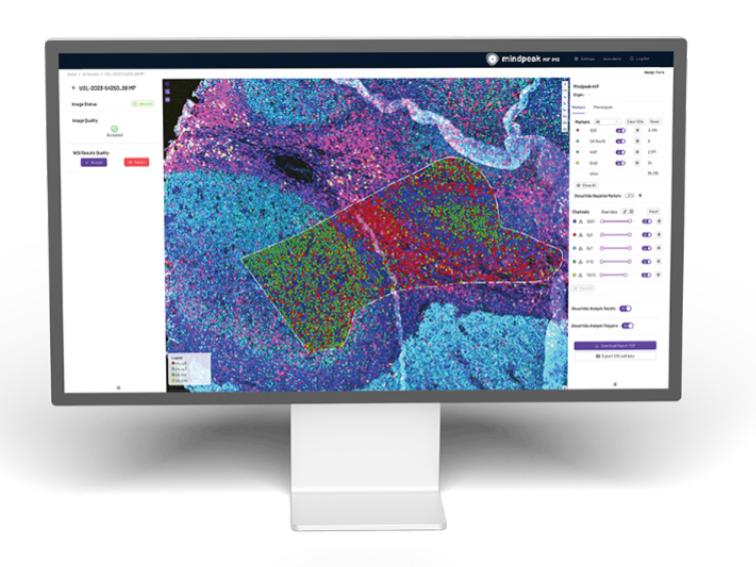
AI-powered spatial biology image analysisTransform multiplex immunofluorescence and IHC images into quantitative insights with Phenoscout, an AI-powered image analysis platform for spatial biology.
Integrated with the ZEISS Axioscan 7 spatial biology workflow, Phenoscout brings image review, AI-based analysis, project organization, quality control, and reporting together in an intuitive, browser-based environment. Researchers can access and analyze their images remotely, helping teams streamline workflows and scale spatial biology studies across projects and sites.
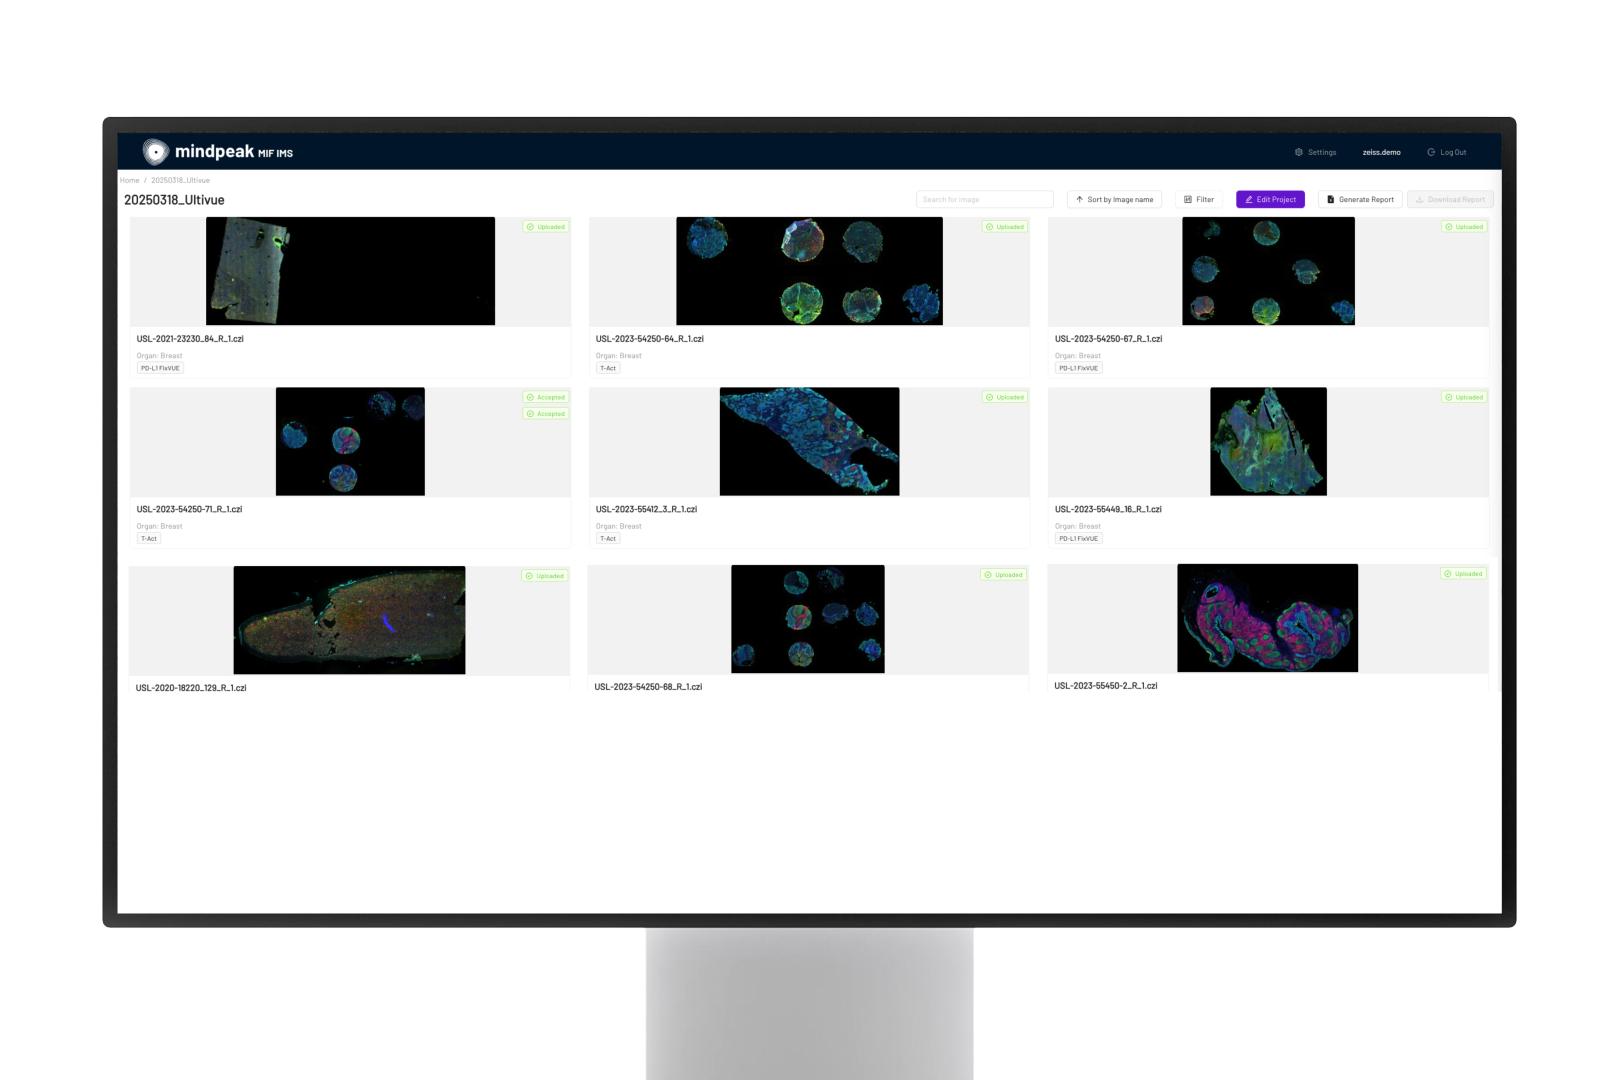

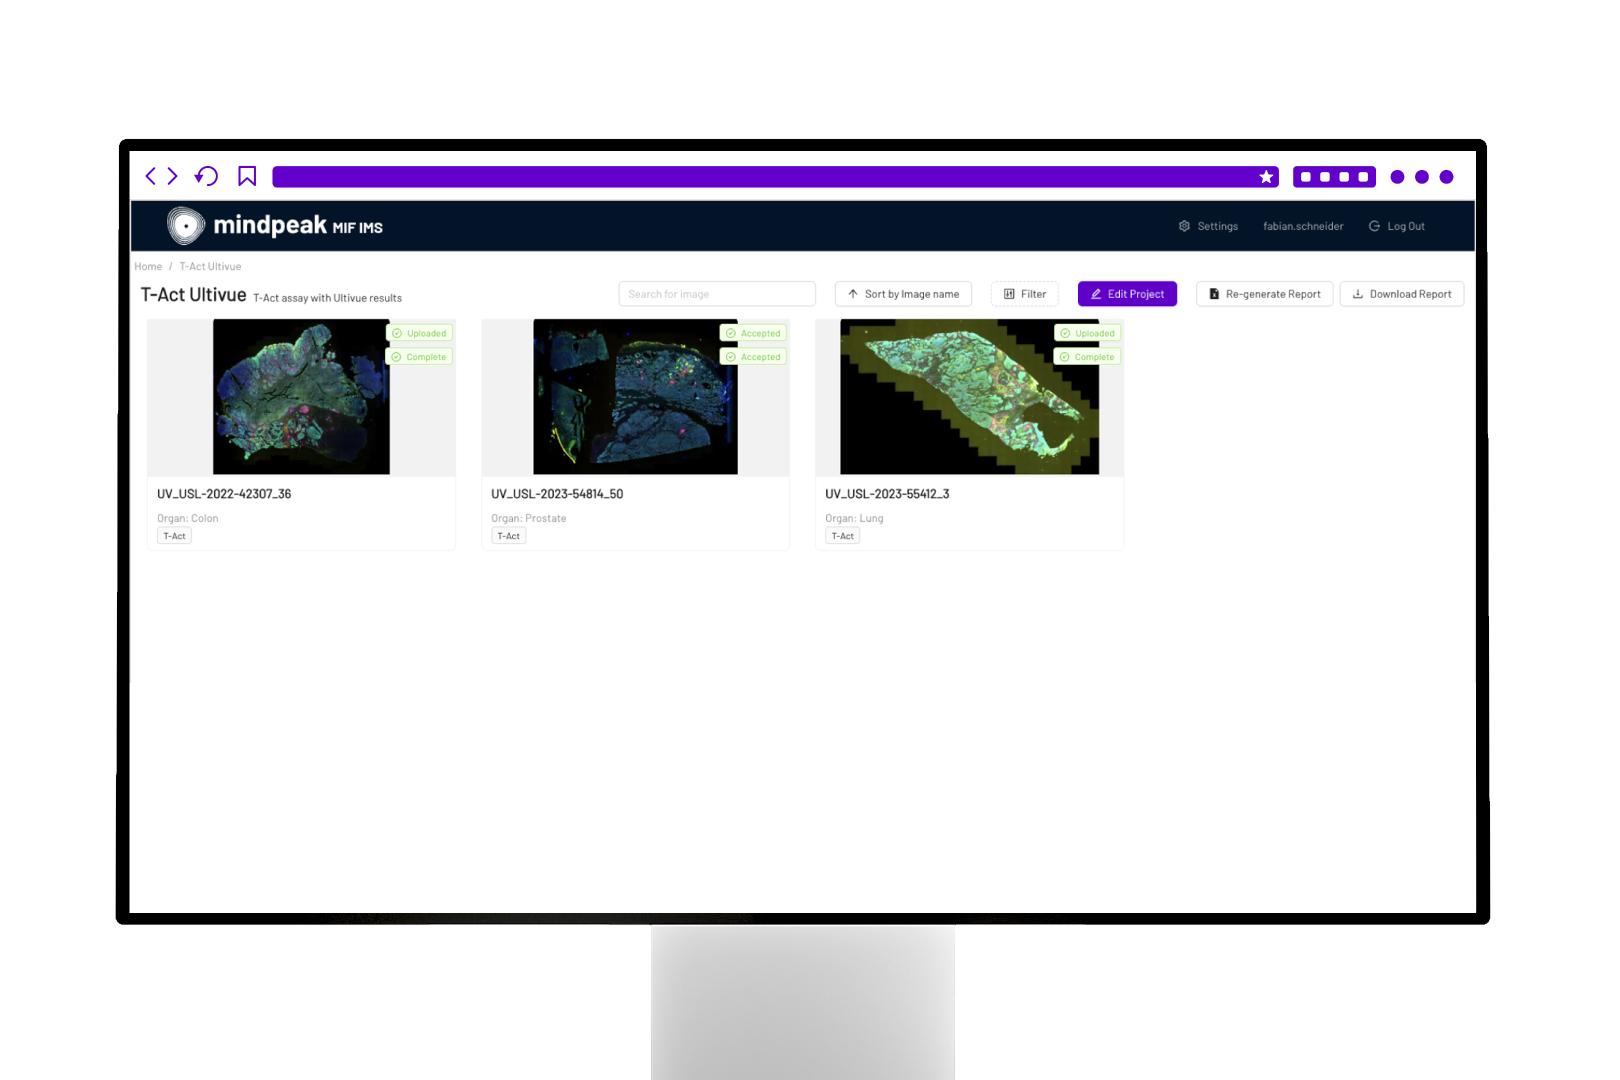

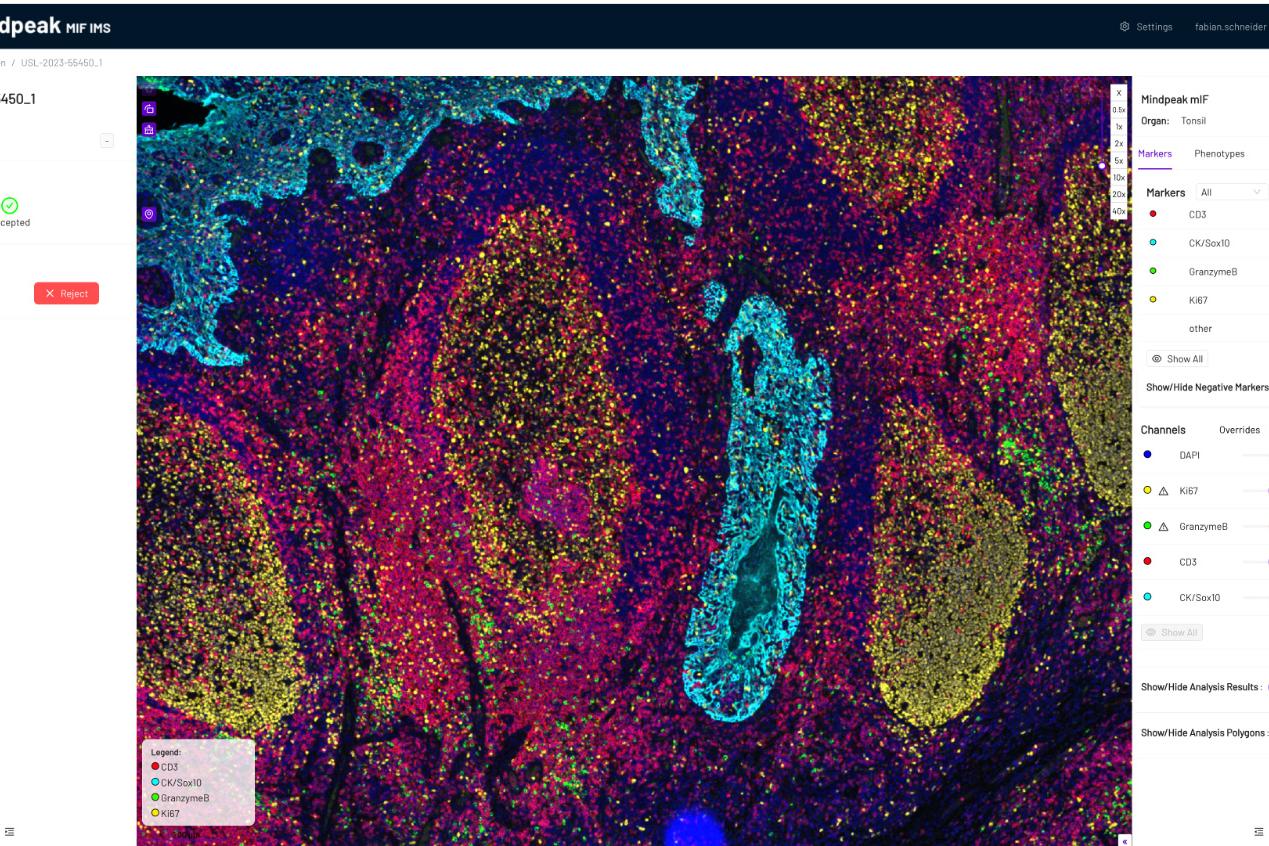

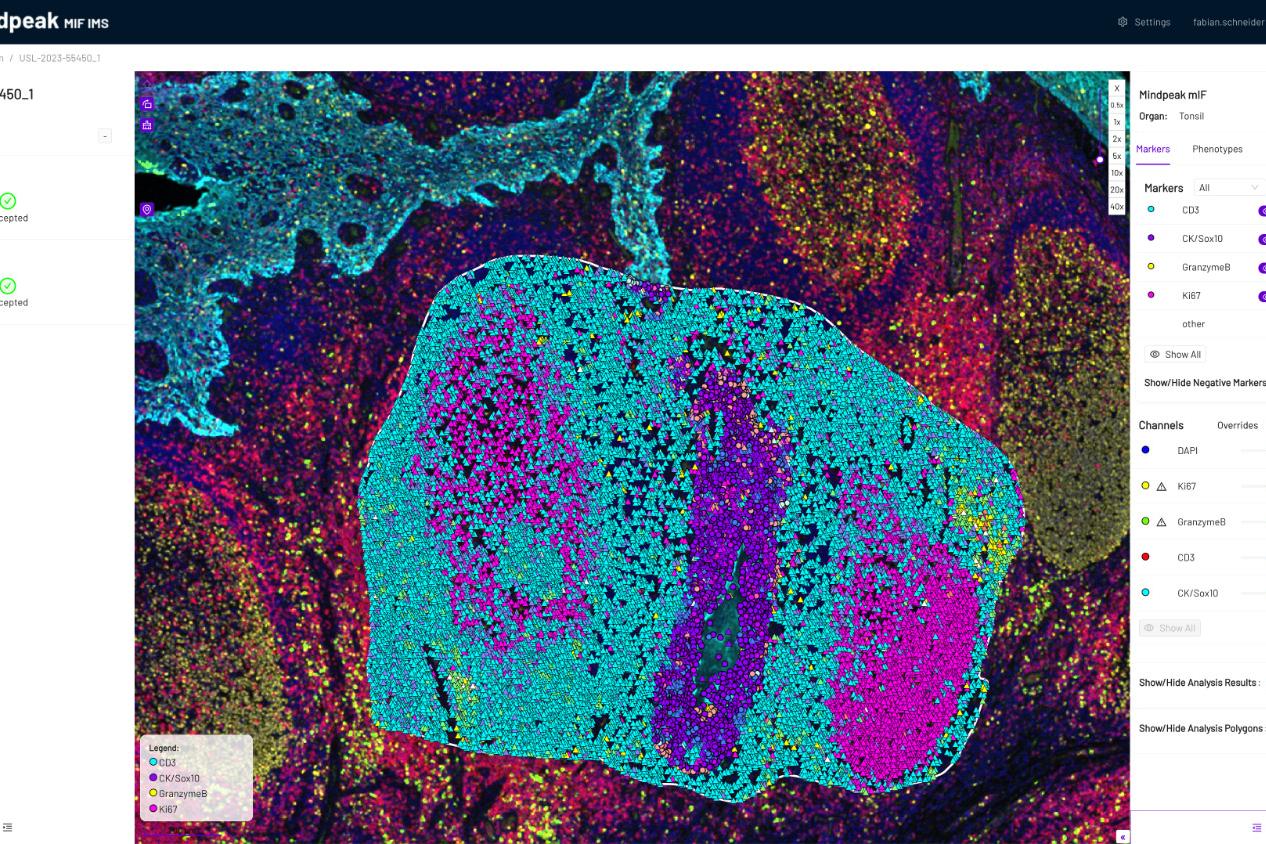

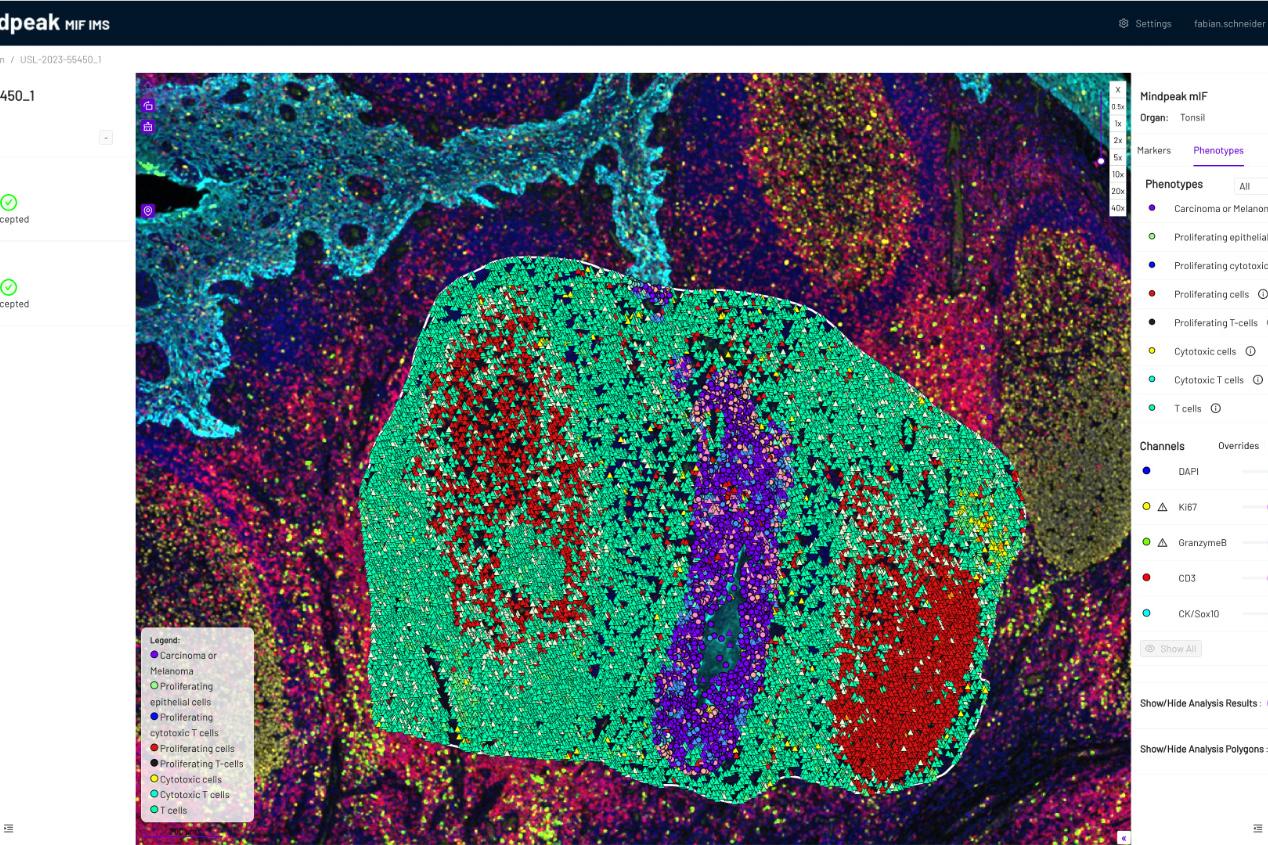

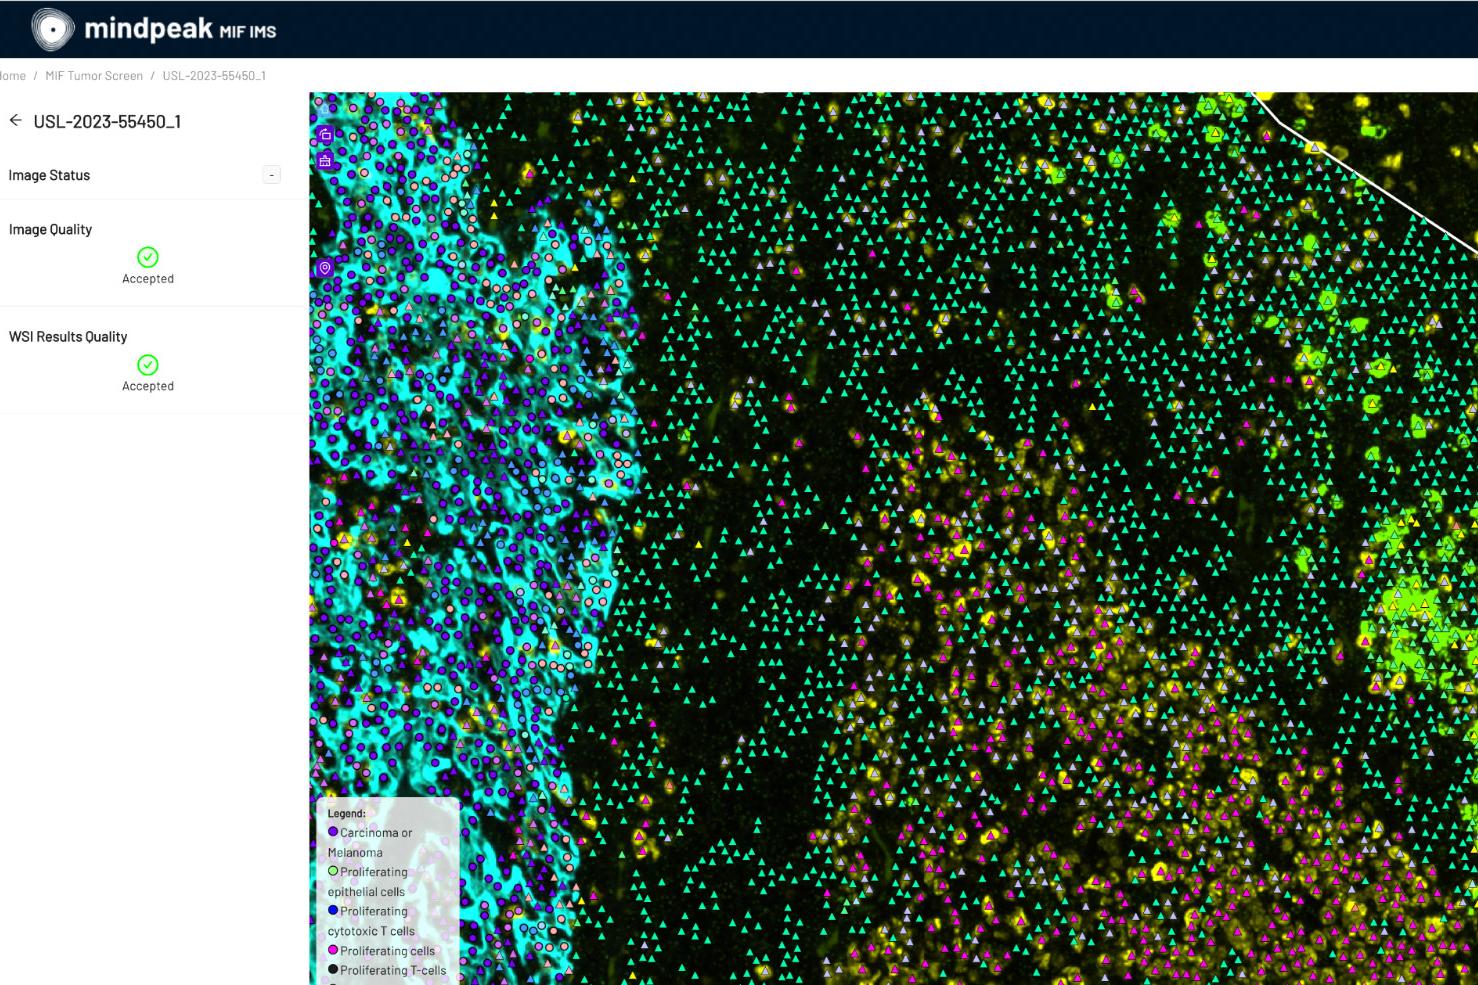


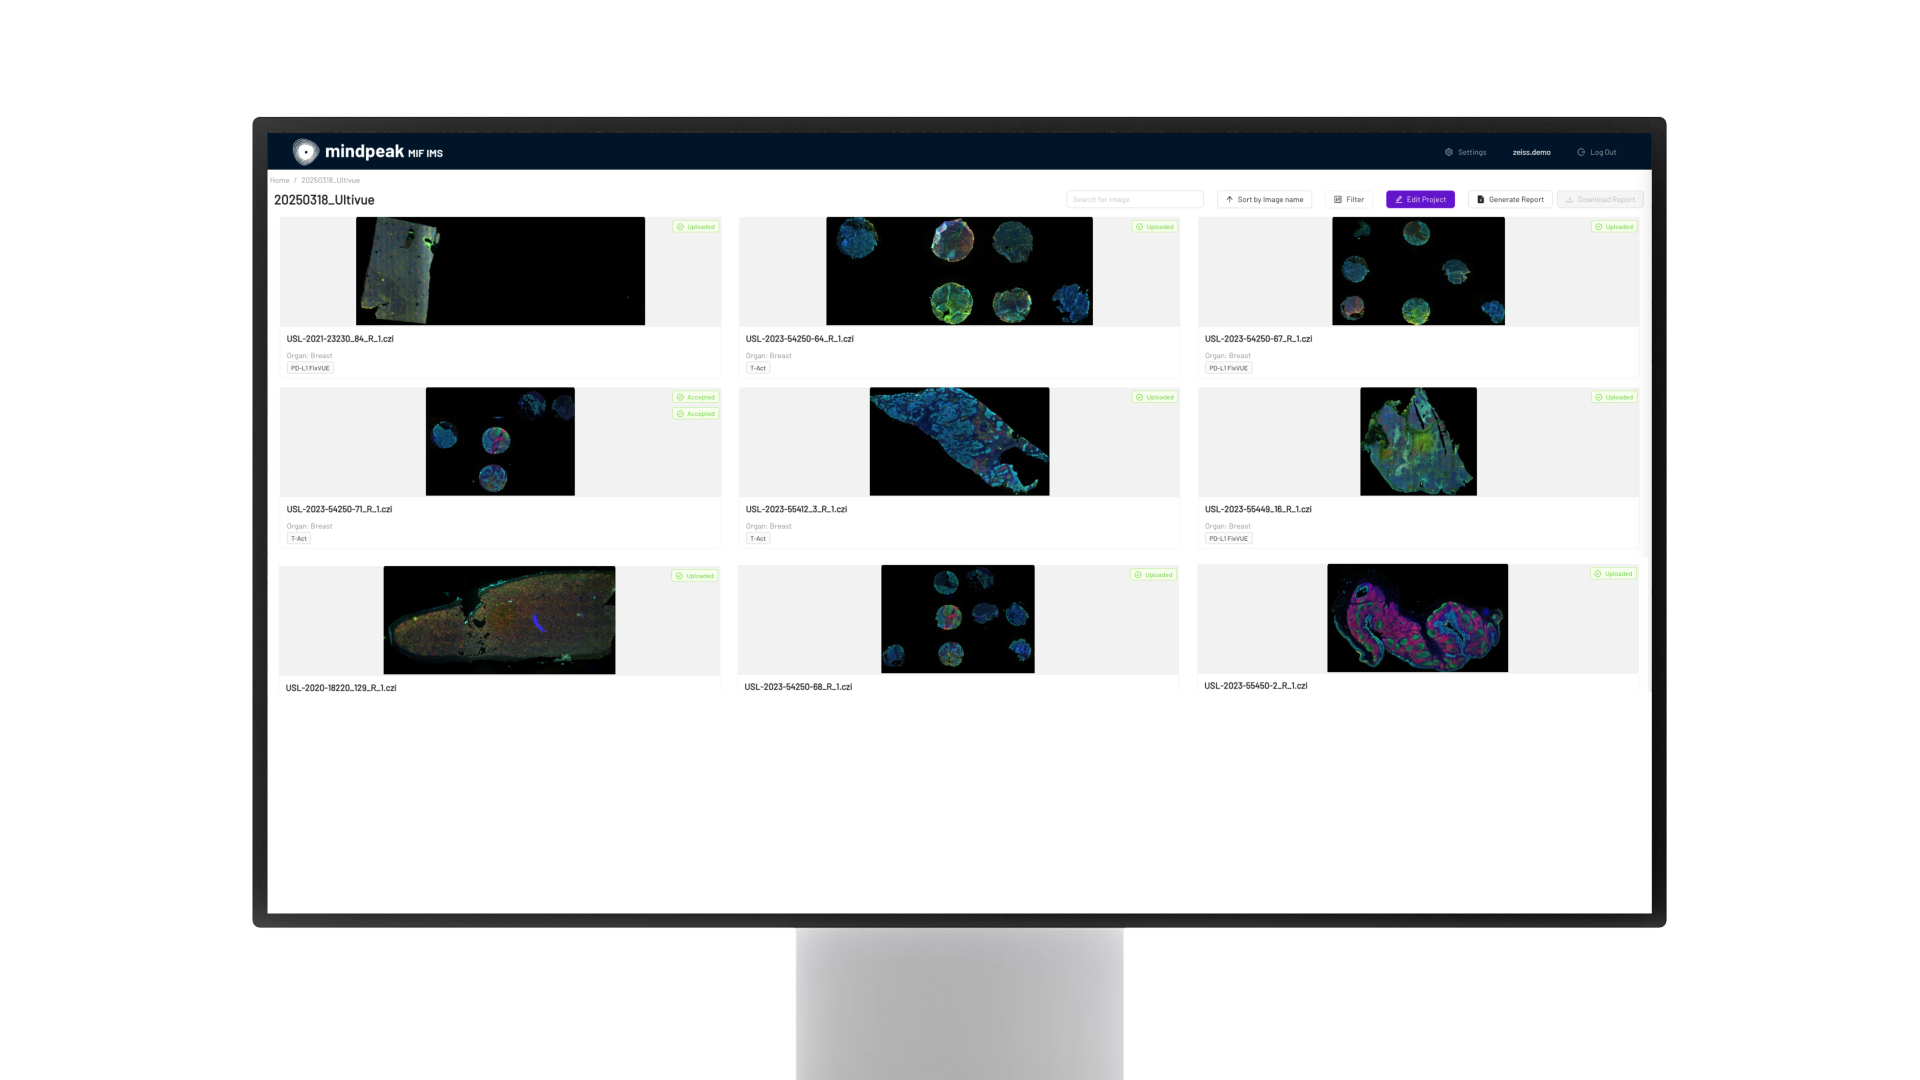

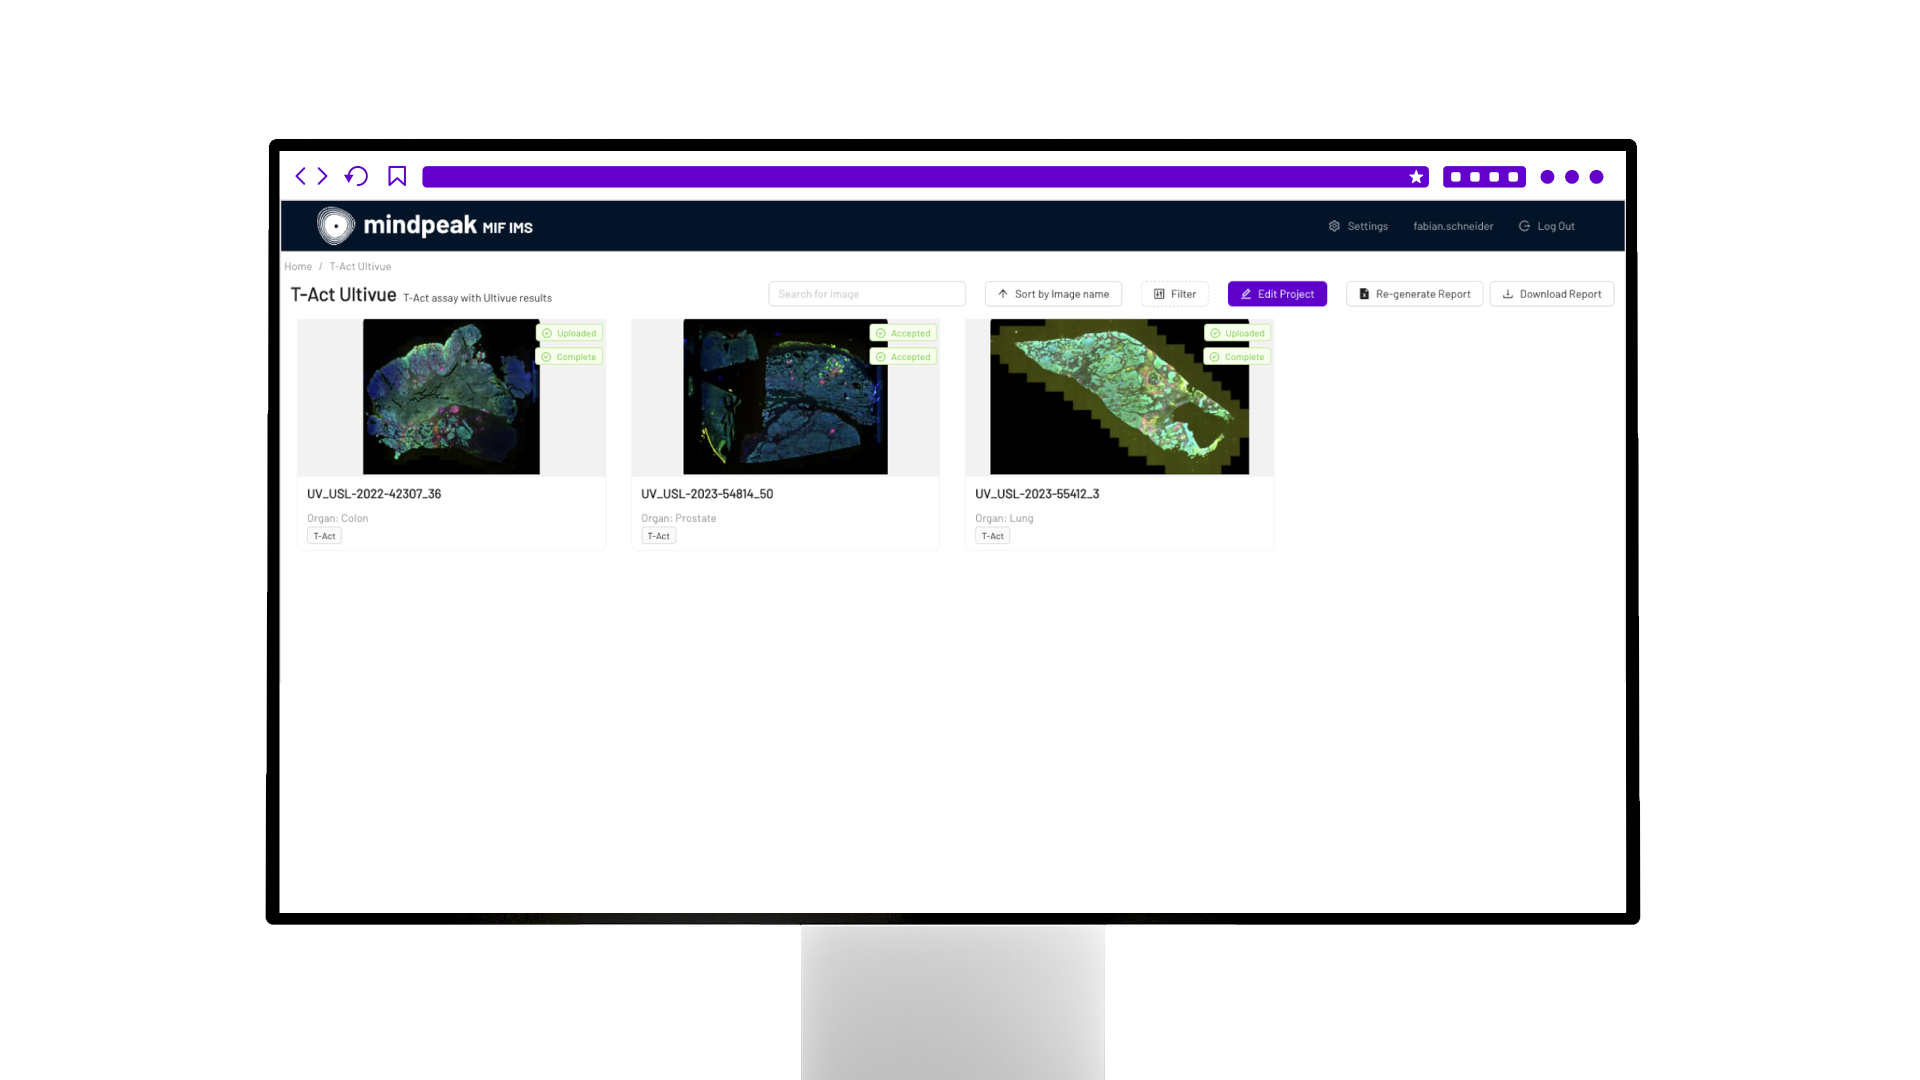

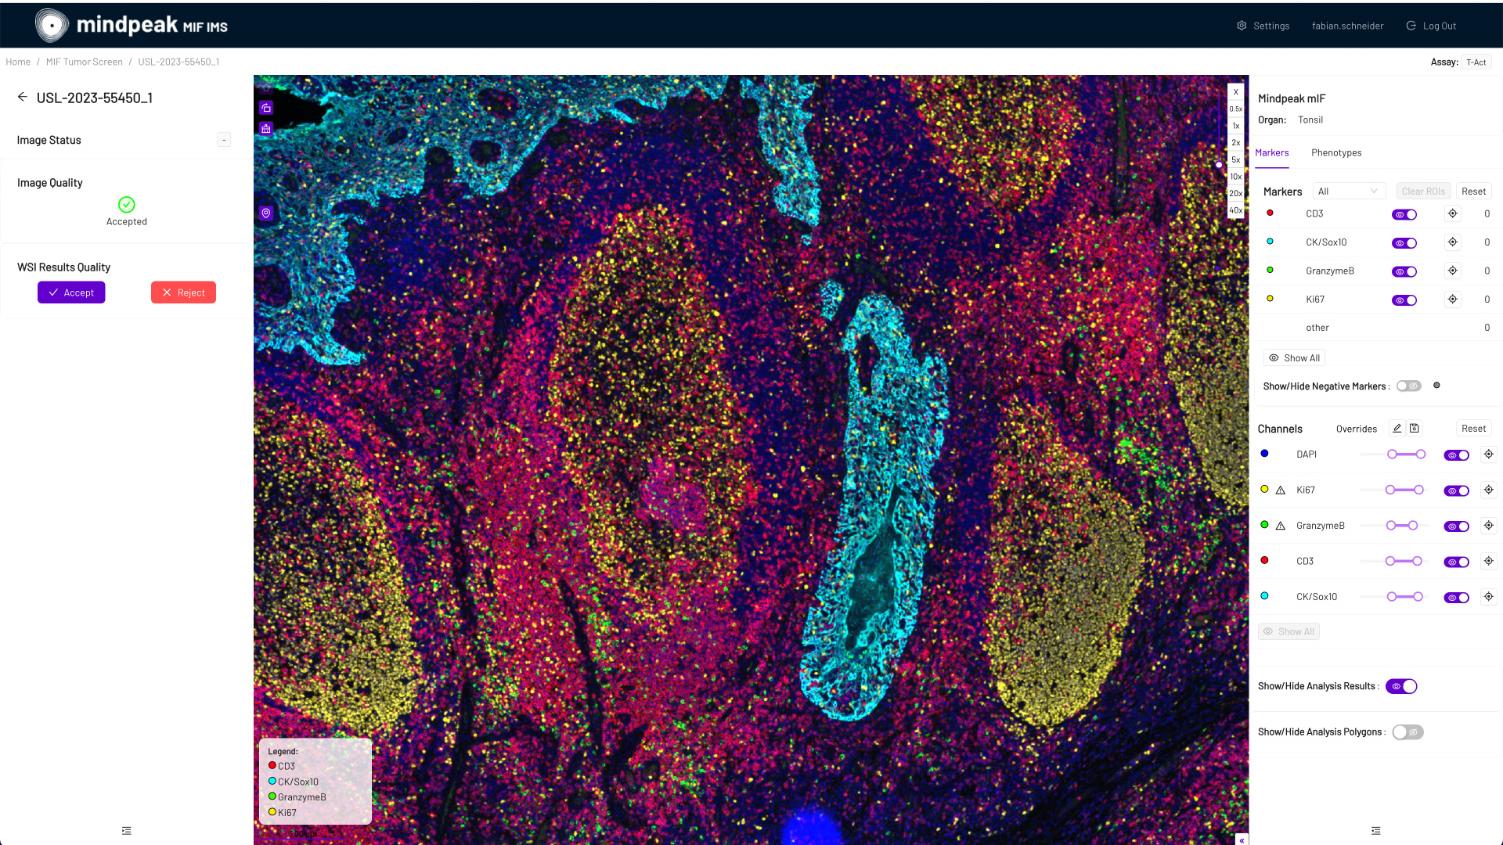

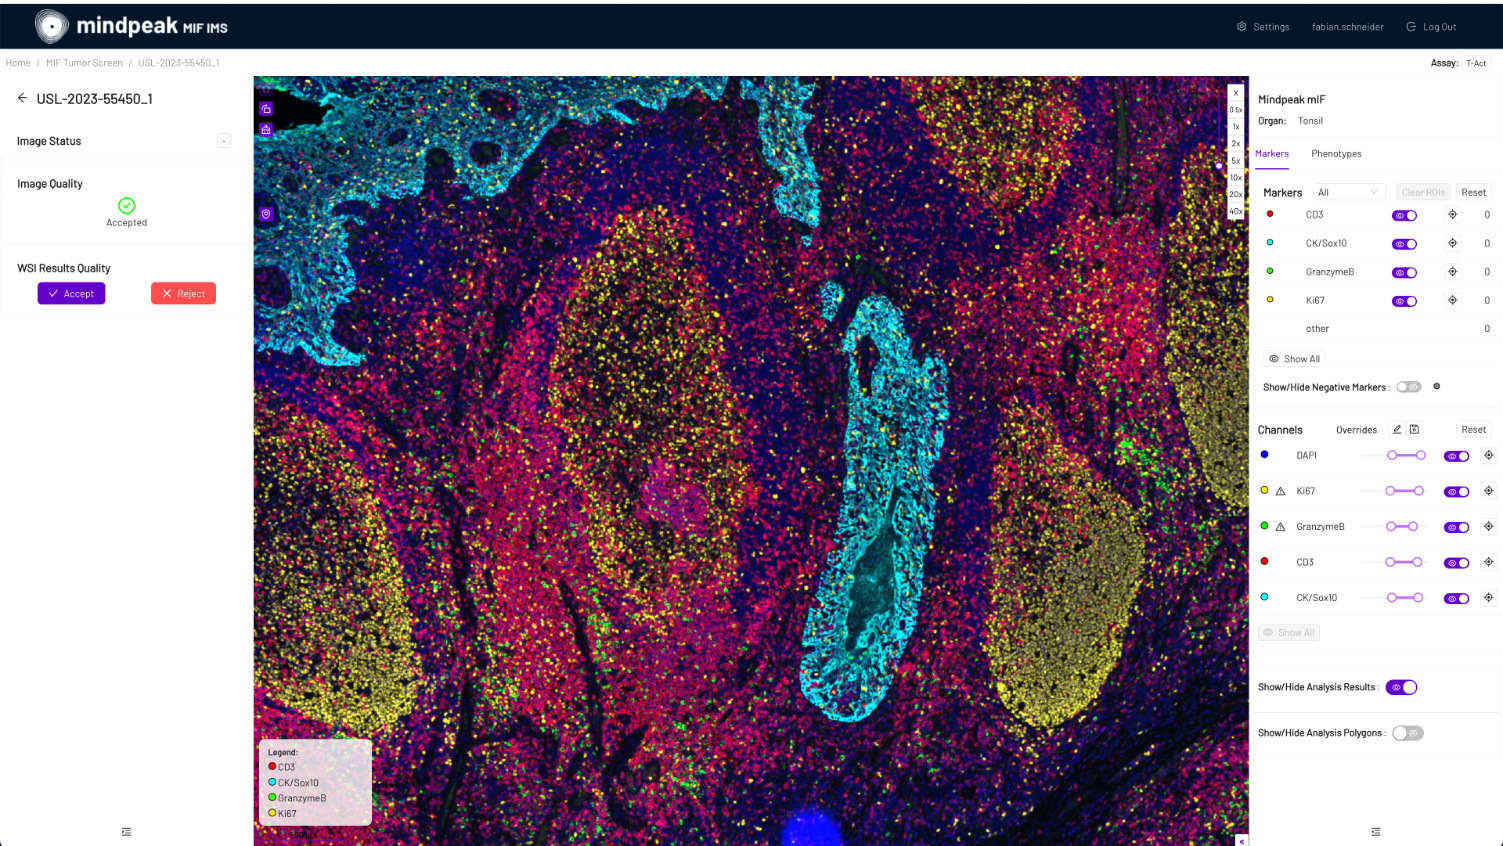

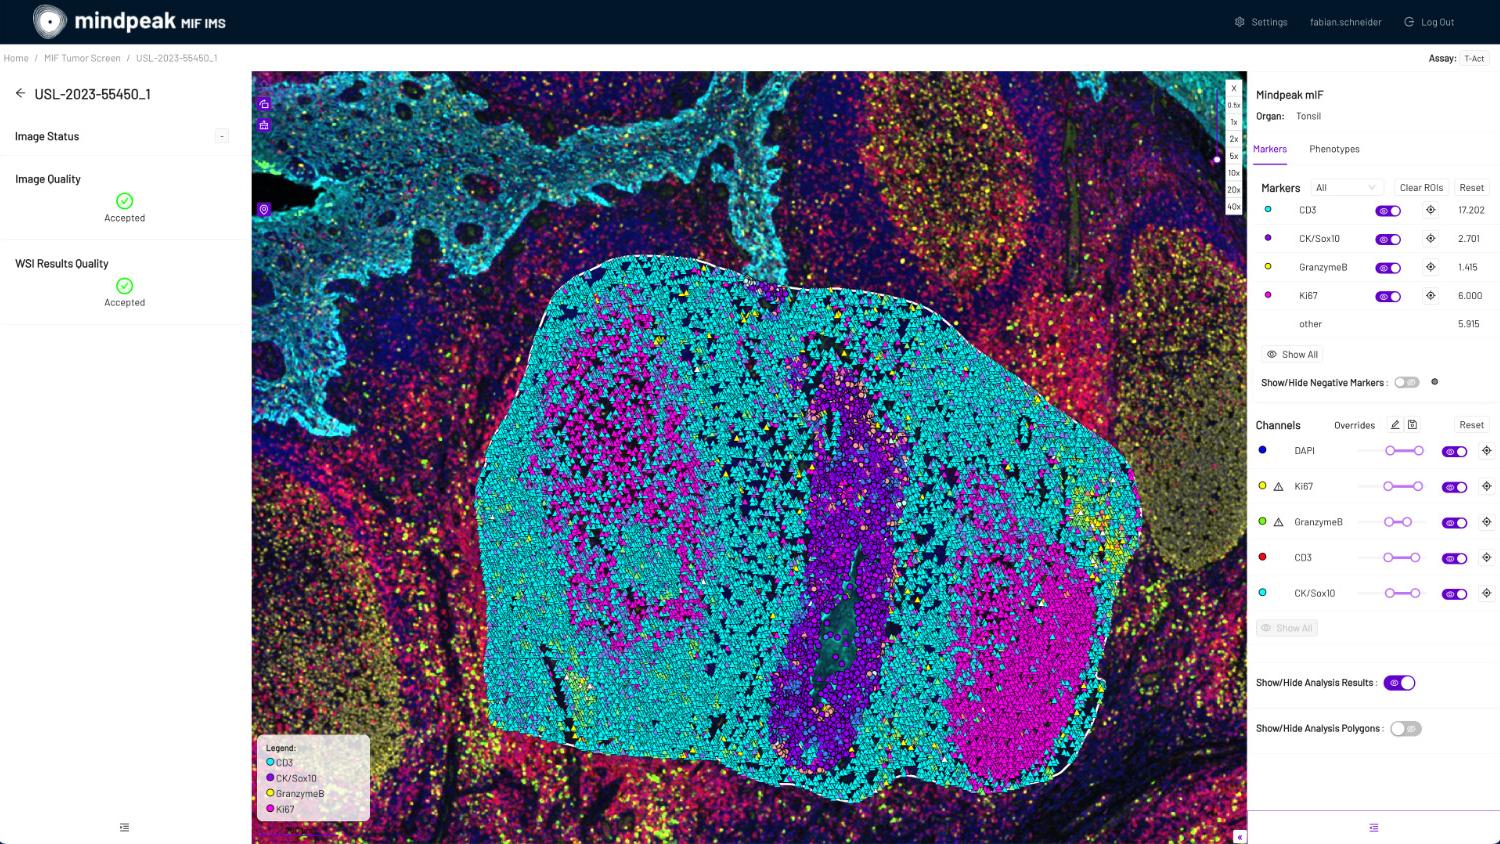

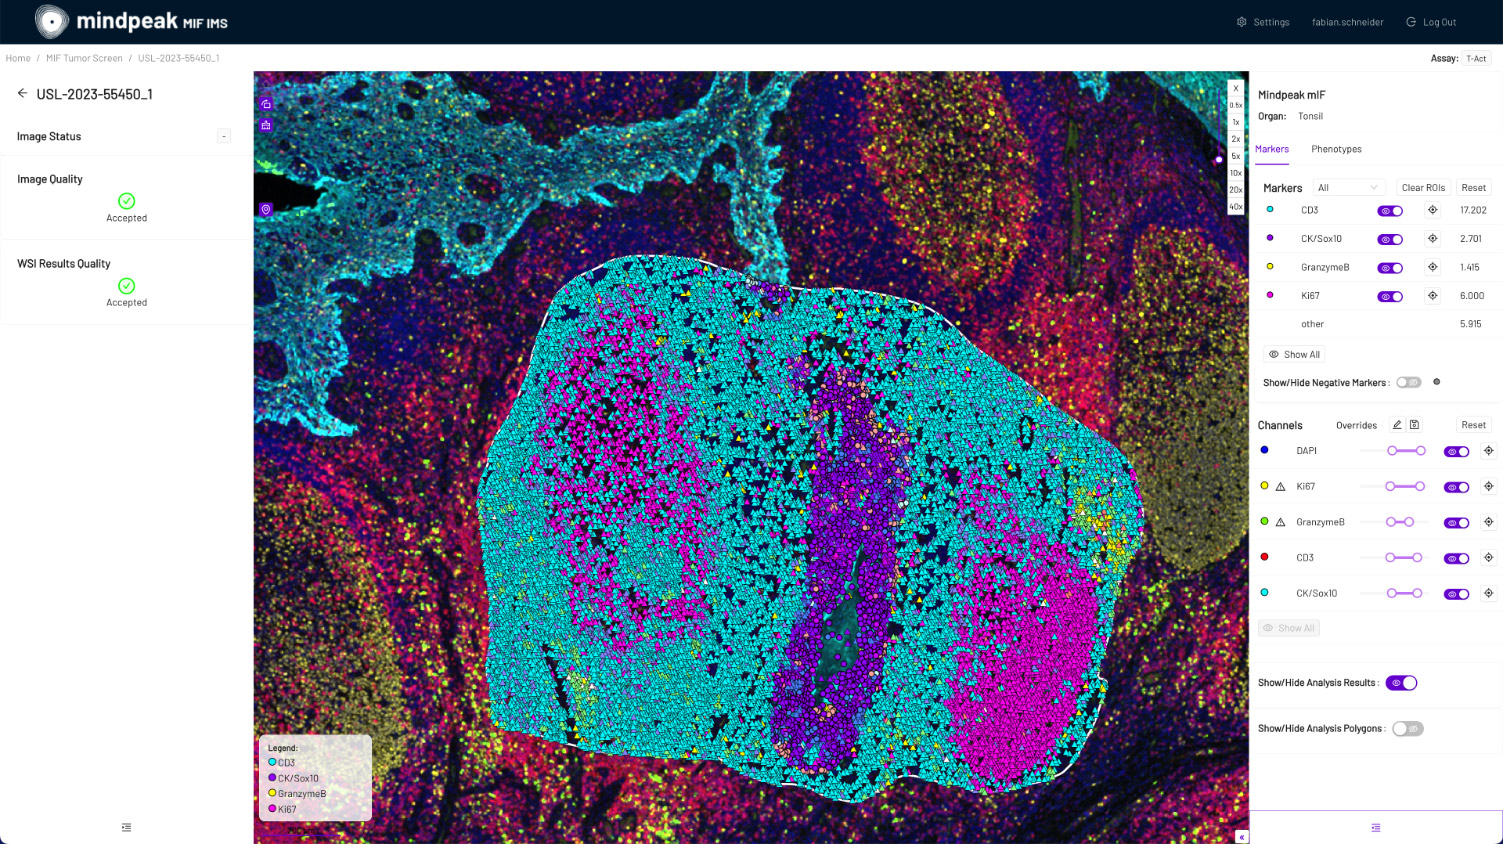

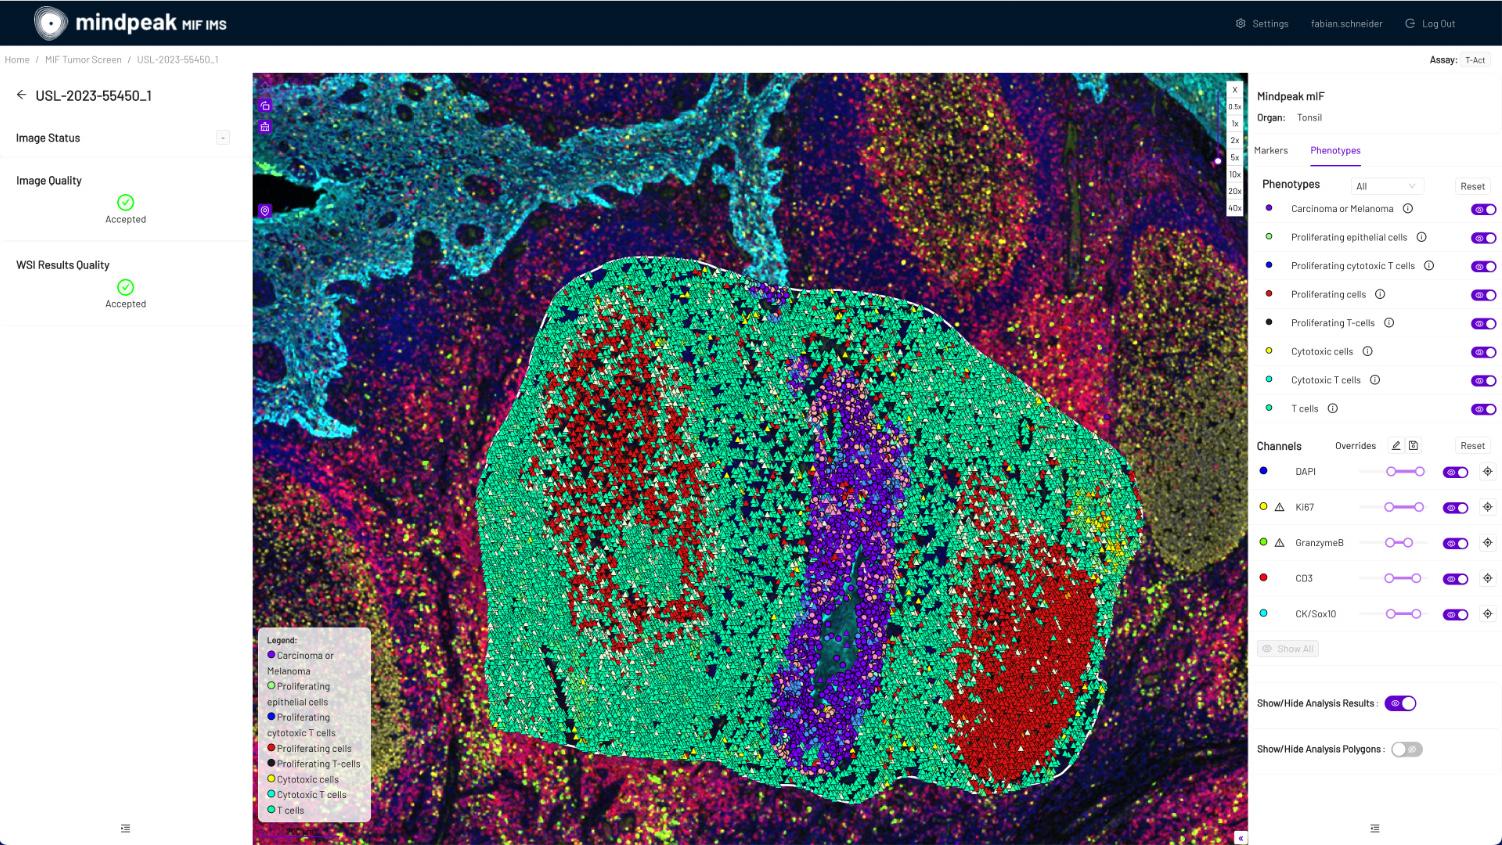

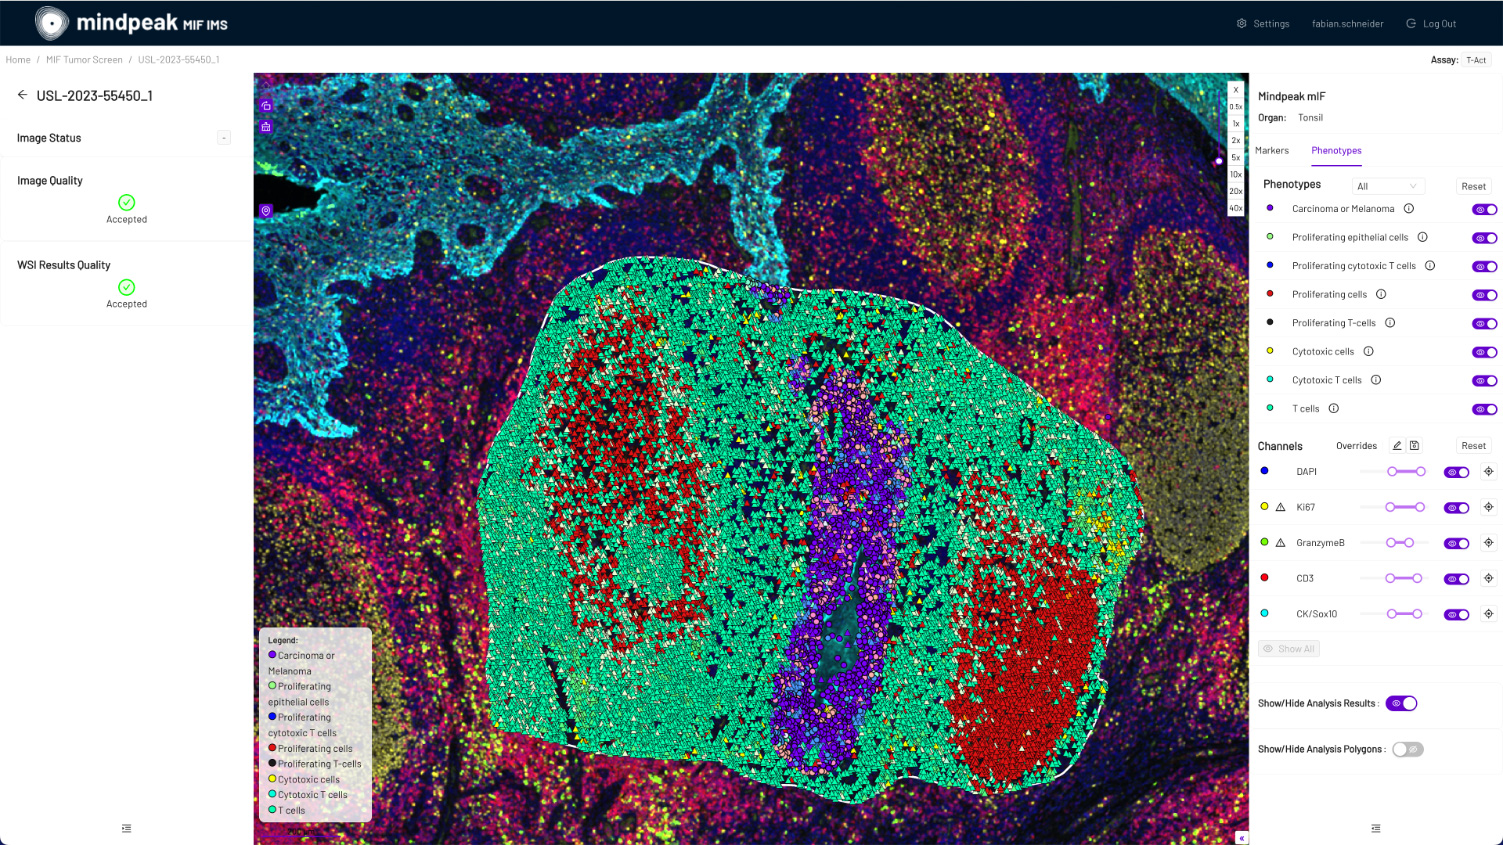

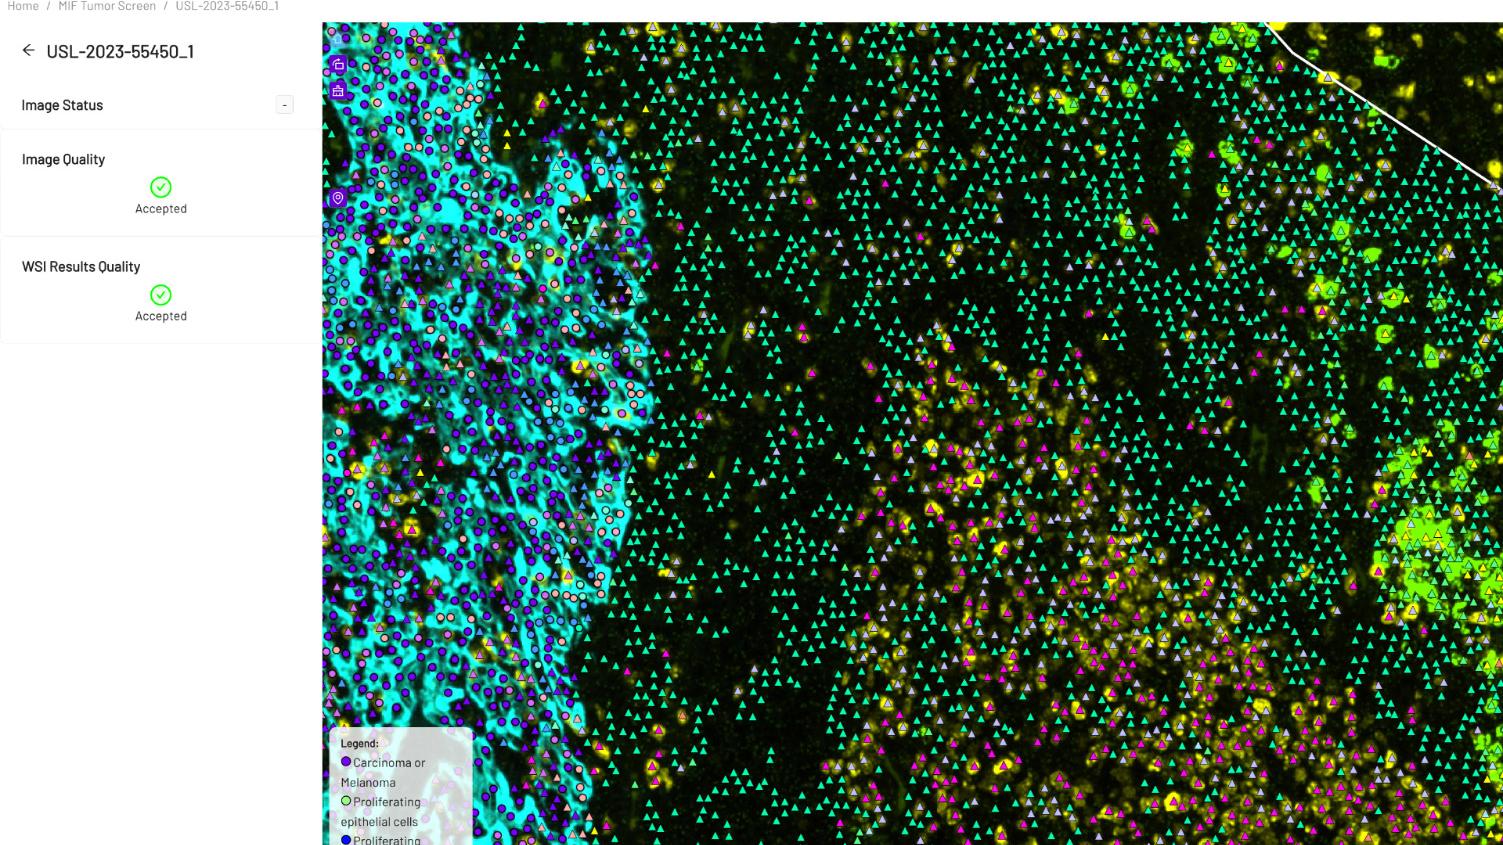

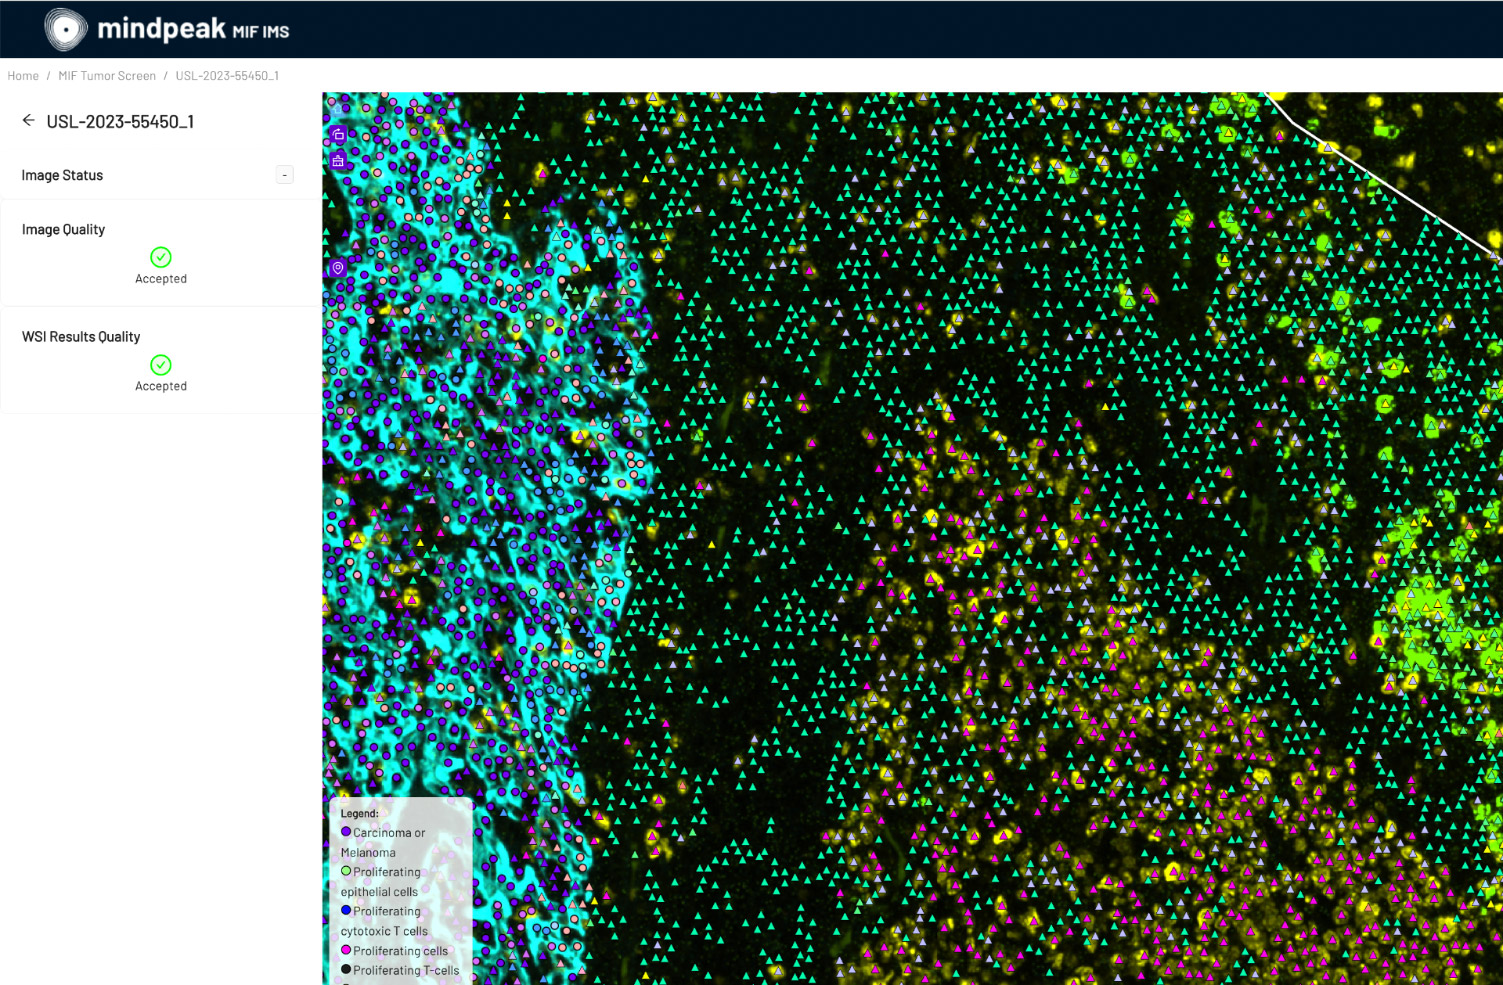


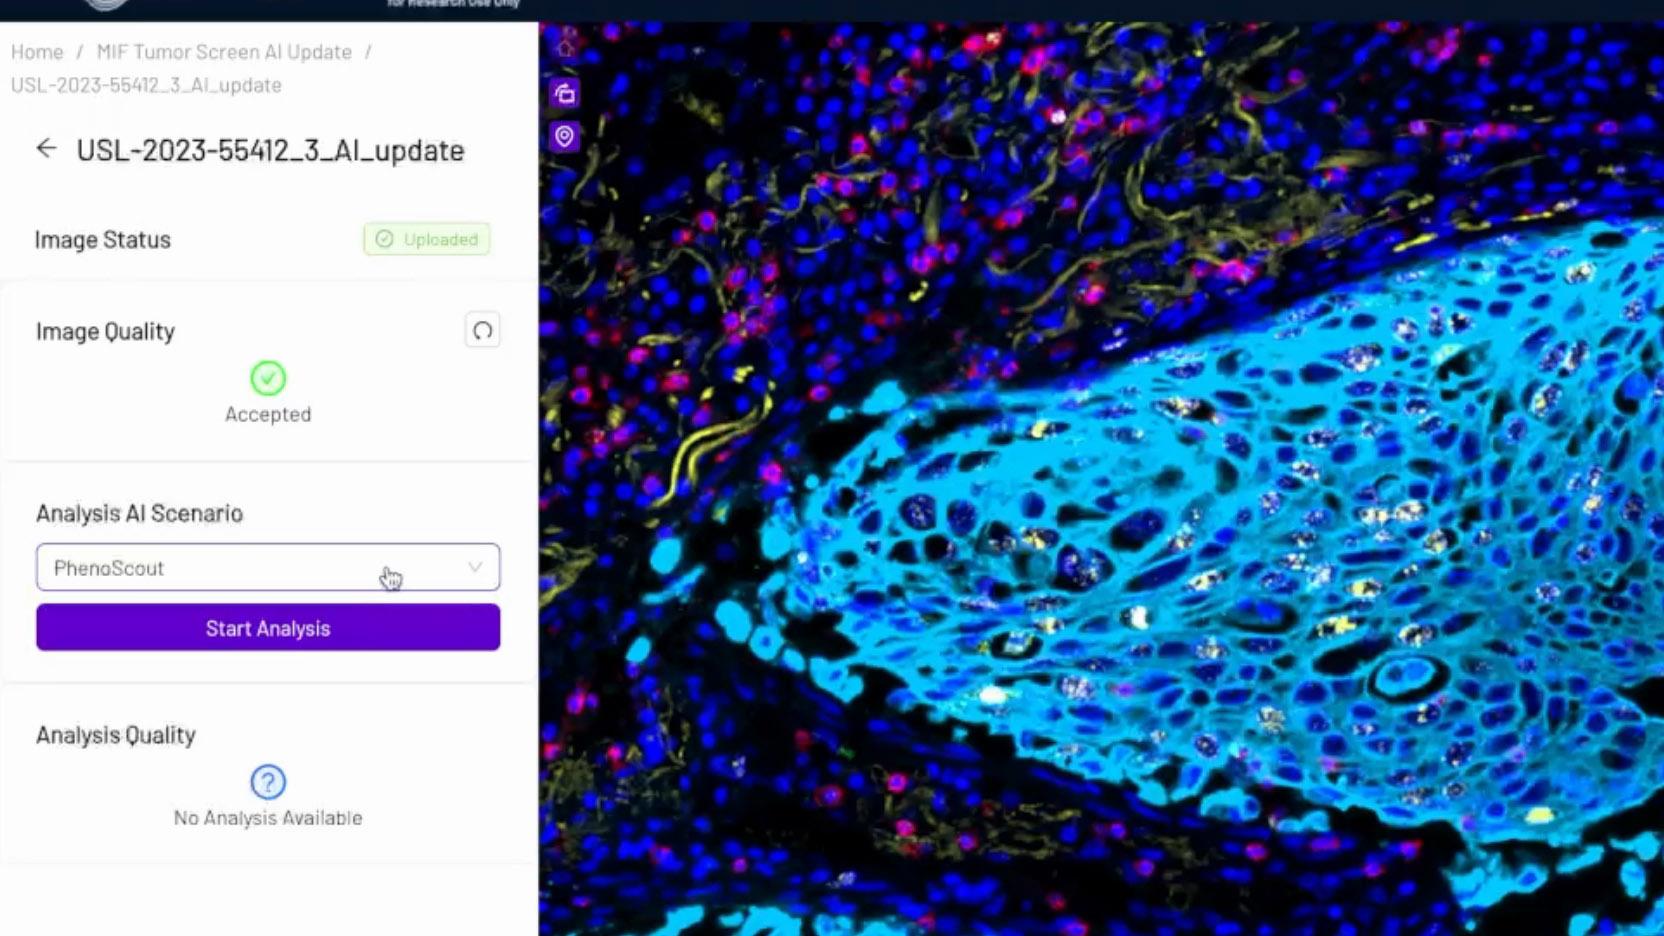

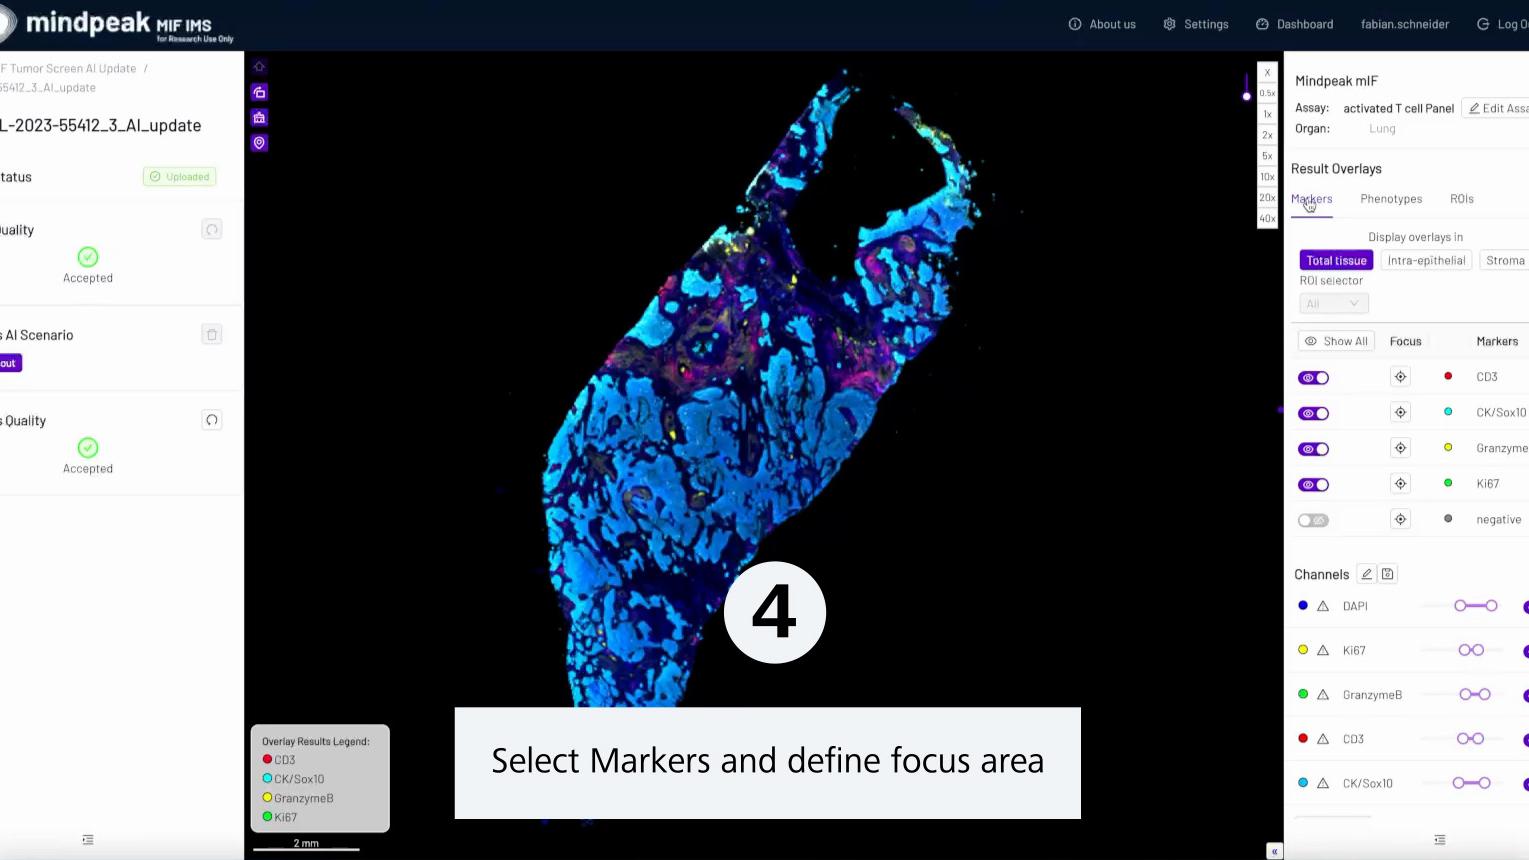

From scanned slide to quantitative result, Phenoscout helps simplify spatial biology image analysis and enables researchers to move from complex multiplex images to reproducible insights at scale.
Broad compatibility with leading vendors
The system supports both DNA-barcoded multiplex immunofluorescence (mIF) and tyramide signal amplification (TSA)-based chemistries, including leading solutions from


End-to-end spatial biology workflow
Seamless sample to report experience 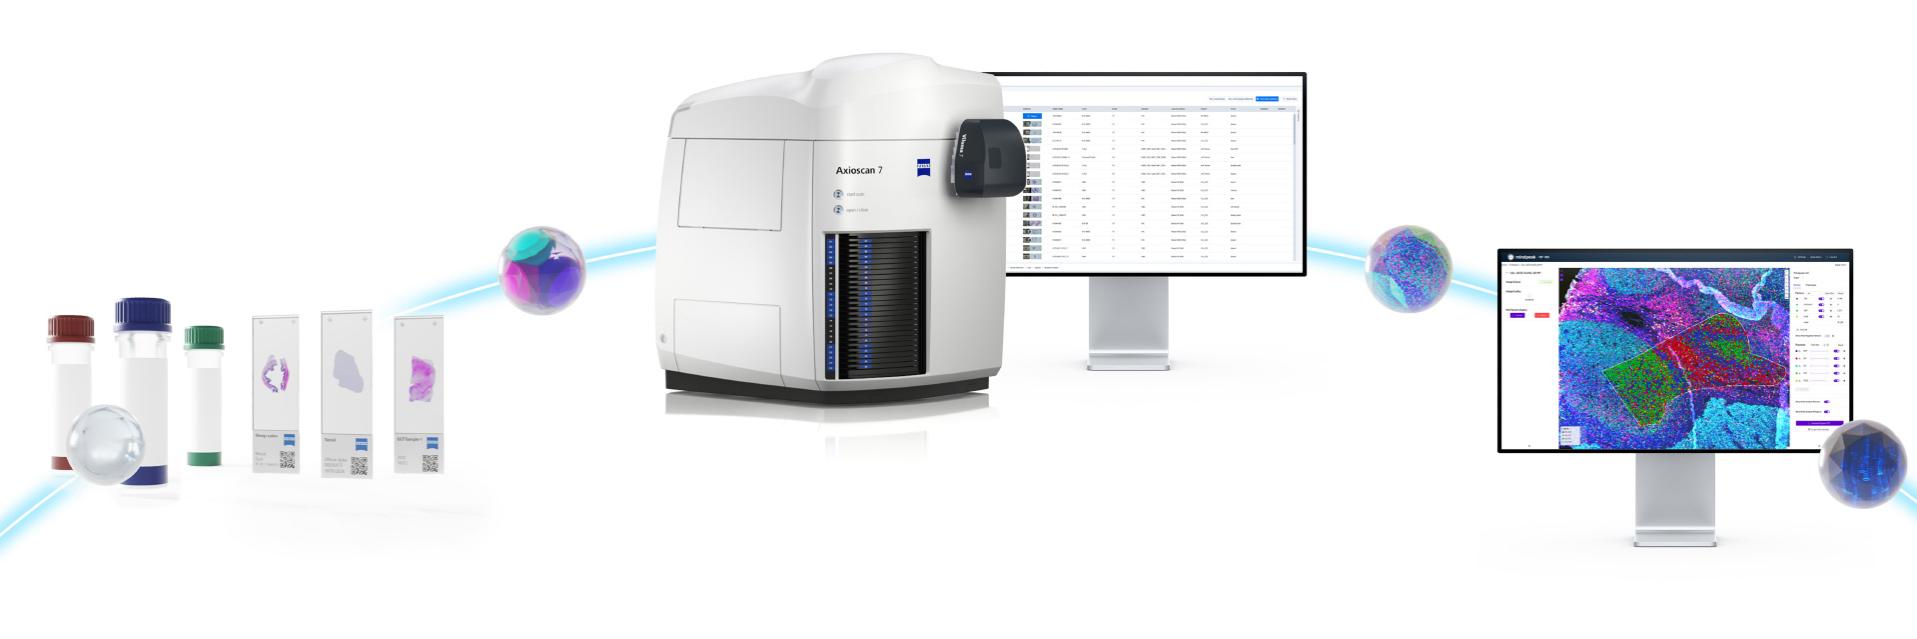

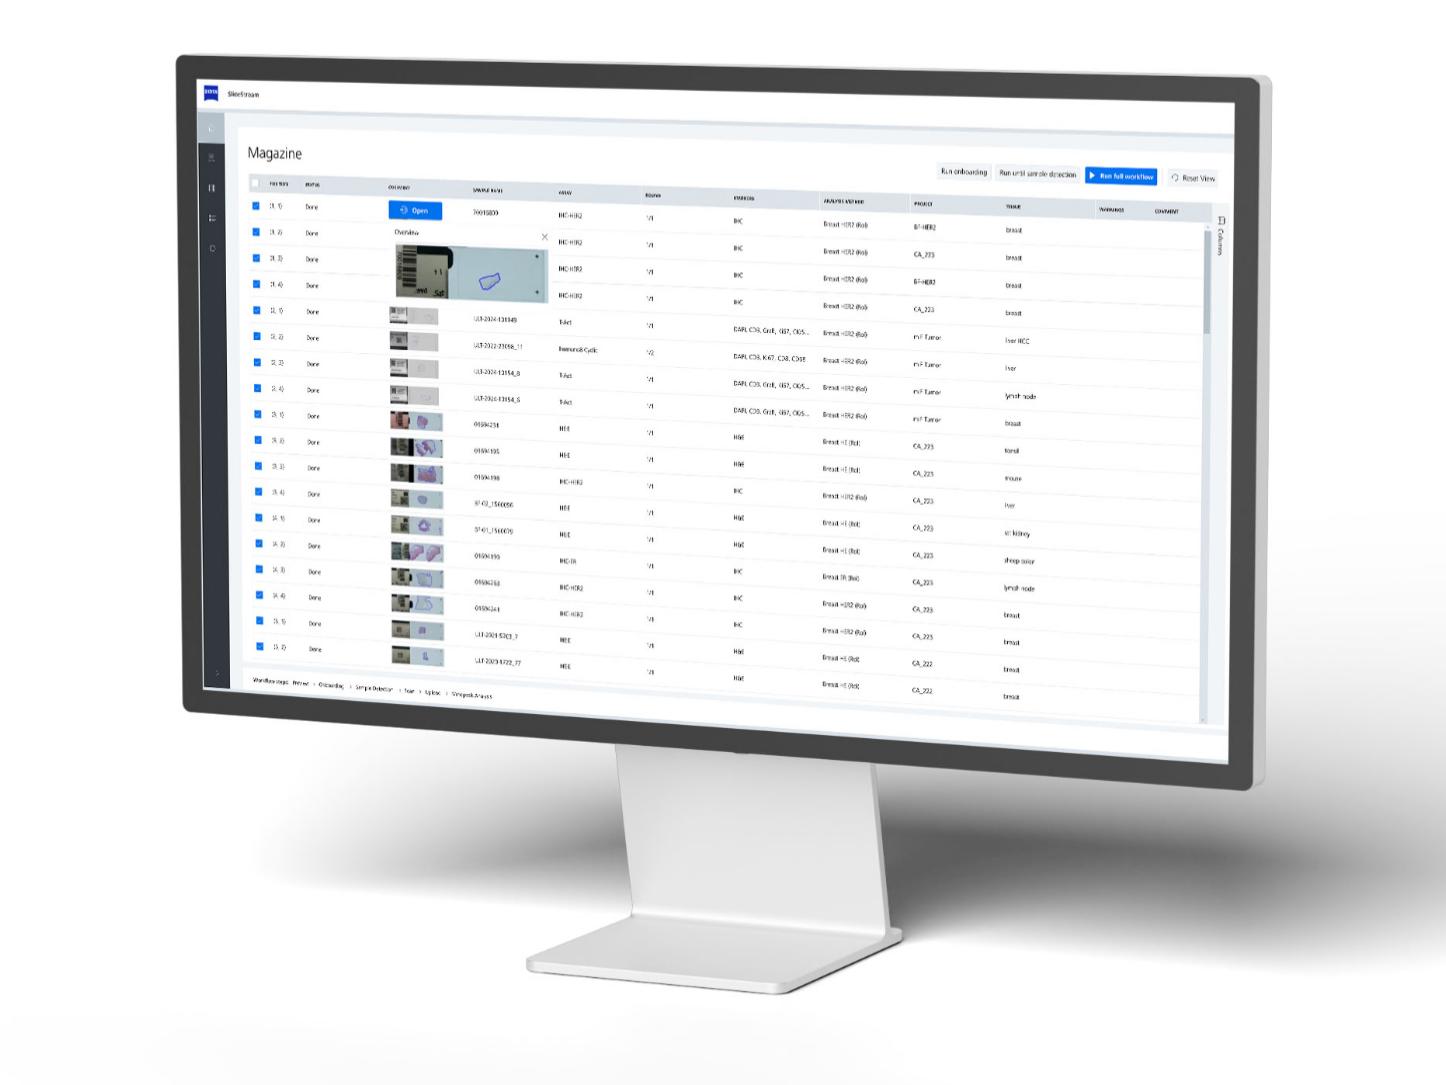

Intuitive workflow automation for Axioscan 7, enabling scalable routine imaging and seamless integration with automated image analysis and LIMS.










FAQs
Axioscan 7 spatial biology
-
The Axioscan 7 spatial biology can separate 8 fluorescence channels, currently supported by Kromnigon SpectraClick reagents. A typical panel could consist of 7 target markers plus DAPI. Supported fluorophores include DAPI, CFP, GFP, DsRed, Cy3, Cy5, Cy7 and fluorophores with similar spectral properties. Single round staining and single shot imaging can be done for 8-channels. For going to higher marker numbers (e.g. 14, 28, etc.) cyclic staining and imaging can be performed.
-
The system supports a broad set of recommended reagents and fluorophores that align with the built-in filter sets. When using an optimized assay with balanced signal intensities between neighboring channels, channel crosstalk is minimal, typically around 4%. If needed, integrated spectral unmixing can be applied as an automated post-processing step, further refining signal clarity without additional user effort.
-
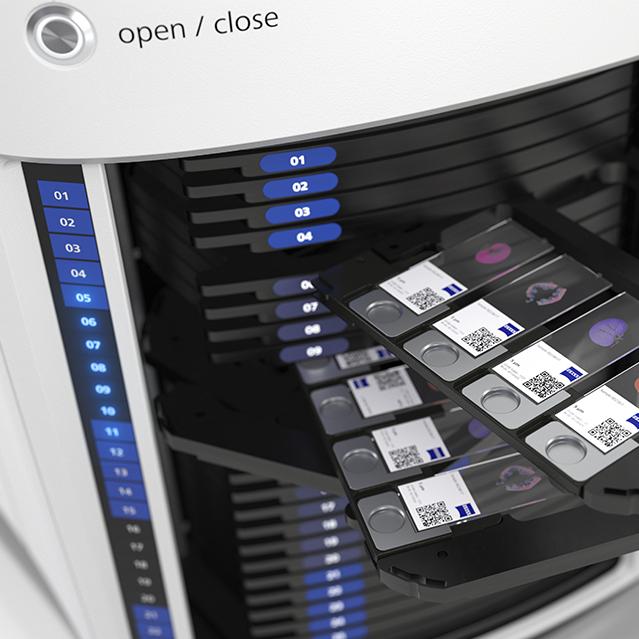
The physical slide capacity of the system is 100 slides (25 trays, 4 slides each). The system can image over 100 slides per day thanks to the high level of automation and high scan speed. 10 mm2 tissue area can be scanned in 3 to ~10 minutes pure scan time for 5- or 8-Plex respectively.
-
If you're using an Axioscan 7, an upgrade to the Spatial Biology configuration is possible. An upgrade path from Axioscan Z.1 is not available. For more details on how we can support your transition, please contact your local ZEISS sales and support team.
-
No, antibody staining is performed off-instrument. Depending on the assay system, the entire panel can be stained at once or in multiple rounds, either manually or using an automated stainer, prior to scanning with the Axioscan 7 Spatial Biology system.
-
Yes. A single run can include up to 100 slides, each potentially containing multiple tissue sections or cores. Pre-configured scan profiles for mIF and chromogenic assay stained tissue can be selected per sample, allowing users to load and run diverse experiments in one batch, in a single automated workflow.
-
We recommend a tissue thickness of 2–10 μm for optimal scanning. However, for thicker sections, the system supports Z-stack imaging to capture multiple focal planes, ensuring high-quality data acquisition.
The recommended thickness for having optimal results with the data analysis algorithm is 2-5 μm.
SlideStream workflow manager
-
No prior microscopy experience is required. The software and scanner are designed for ease of use, with an intuitive interface and automated workflows that enable any operator to run the system efficiently, with minimal or no training.
-
The system includes a library of pre-optimized scan profiles for assays from supported reagent providers, stored in its database. By integrating with the user's LIMS or lab book system, the Axioscan automatically retrieves sample information, including assay type, and applies the appropriate scan profile eliminating the need for manual setup or extensive training.
-
Yes. SlideStream includes a simplified feature for setting up custom assays, allowing users to quickly define scan and analysis settings without complex configurations. This enables flexible adaptation to new assays while keeping the workflow efficient and user-friendly.
-
Yes, you can import a simple CSV file containing sample names and assay type information, which can be uploaded to the system for seamless operation. Alternatively, you can manually enter sample details directly in the software interface and select the appropriate assay to start the scan.
-
The Axioscan 7 connects to the LIMS by scanning QR codes or barcodes printed on the slide labels. The scanner reads the slides unique ID from the code on the sample, retrieves the required additional information from the LIMS, which will be used to automatically populate the SlideStream interface with the relevant details, streamlining the workflow and reducing the need to manually re-enter pre-existing data.
Image Management System and data analysis platform
-
For optimal performance, we recommend using the latest version of Google Chrome, a stable internet connection with at least 10 Mbps bandwidth, and a computer running a current, up-to-date operating system. These requirements ensure smooth and responsive operation of the platform.
-
Through the SlideStream workflow, images are automatically uploaded to the customer-specific cloud server instance as soon as scanning is complete. Once uploaded, they are immediately accessible for review in the mIF IMS. An active internet connection is required for the scanner to enable this seamless data transfer.
-
No, the IMS is browser-based and requires a browser to access its interface. However, it is possible to install a local, non-cloud deployment option that still uses the browser but operates entirely within the customer’s network. In this setup, our dockerized AI models are installed on-premises, ensuring that image and result data remain fully contained within the local infrastructure. Please contact us to discuss further details on the process.
-
Currently, a standalone version without ZEISS SlideStream is not available. However, we’re actively exploring this option. In the meantime, we offer customized integrations with existing IMS platforms. These can range from shallow integrations, launching results in a separate Mindpeak IMS browser window—to deep integrations where results are directly embedded into third-party IMS viewers. Our experience from partnering with 16 IMS providers, including Paige, Sectra, Philips, and Proscia, supports seamless integration into mIF workflows.
-
Yes, local deployment is possible. For customers handling large image volumes or requiring local data storage, Mindpeak offers hybrid deployment options. In this setup, data is stored on the customer’s server while processing is performed on Mindpeak’s secure cloud infrastructure, helping reduce storage costs while maintaining greater control over sensitive data.
-
Cells are detected by the foundation model based on the nuclear counterstain input, e.g. DAPI and each individual marker channel. In contrast to non-AI based methods, the cell detection is based on the visible morphology of the cells, making those solutions very robust. Foundational AI models are based on 10.000s of images and millions of data points across many different markers and tissue types and allow the detection of similar markers without further training.
-
Storage limitations are defined by the IT infrastructure of customers as defined in their purchased packages. Additional storage capacities can always be acquired ad hoc in alignment with customer needs and budget requirements.
-
We recommend an internet connection of 100 Mbit/s or higher, with 1 Gbit/s ideal for smoother performance, especially when working with large images or in multi-user environments. For the best experience, use Google Chrome (version 120 or higher).
-
We partner exclusively with ISO 27001-certified cloud providers, such as AWS and Hetzner, to ensure enterprise-grade data protection. All data is encrypted both at rest and in transit, and regular security audits are performed to safeguard your sensitive research. These measures ensure your data remains secure, private, and fully under your control.
Related products

-
1
Not all products are available in every country. Contact your local ZEISS representative for more information.