From Image to Resuls | High Content Imaging for Genotoxicity
Author Dr. Philipp Seidel Product Marketing Manager Life Sciences Software
ZEISS Microscopy
Abstract

From Image to Results | High Content Imaging for Genotoxicity

In this series "From Image to Results", explore various case studies explaining how to reach results from your demanding samples and acquired images in an efficient way. For each case study, we highlight different samples, imaging systems, and research questions.

In this second episode, we set up an application example to perform DNA-damage analysis by employing ZEISS Axio Observer and the ZEISS arivis Pro image analysis software.

    Key Learnings:

    • How to perform the general analysis with one drug
    • How to automate imaging and analysis procedures, to the point that the whole process can be scaled easily to perform high-content screening (HCS) or be adapted to other complex experimental settings

    Case Study Overview

    Sample

    Clear-cell renal carcinoma cell line SLR22

    Task

    DNA-damage analysis

    Results

    Cell-cycle specific DNA-damage elucidates drug mechanism

    System

    ZEISS Axio Observer

    Software

    ZEISS arivis Pro

    Introduction

    Figure 1A: Scheme of cell-cycle phases


    Figure 1A: Scheme of cell-cycle phases. Note how during S-phase, the DNA content gets duplicated and how during M-phase (cell division), cells need to coordinate the correct segregation of genetic material. Therefore, these two phases are especially vulnerable to genotoxic treatment.

    Microscopy is the preferred experimental tool to study cellular mechanisms of DNA-damage induction or genotoxicity. This is because primary outcomes of genotoxicity, e.g. DNA double-strand breaks or micronuclei, can be readily detected via imaging. For DNA double-strand break detection, antibodies exist that can stain DNA-repair molecules that accumulate around physical DNA damage and form detectable spots called DNA-damage foci. Micronuclei are extranuclear DNA compartments that can be detected with standard DNA stains like DAPI.

    The cell cycle (simple overview shown in Fig. 1A) also plays a profound role in understanding mechanisms of DNA-damage. First, cells are responding to DNA-damage via cell cycle arrest, hence shifts in cell cycle phases are indicative of a drug’s efficacy to inflict DNA-damage. Also, certain cell cycle phases are more susceptible to DNA-damage. The genome is especially vulnerable to genotoxic conditions mainly during DNA synthesis (S-phase) and during mitosis (M-phase) because DNA is actively being processed (by replication or segregation). Third, some drugs act exclusively on specific cell cycle phases, because they target cell-cycle specific molecular mechanisms (e.g. in replication).

    Taken together, the experimental settings to perform DNA-damage analysis are quite complex and require careful execution of imaging and image analysis.

    Material and Methods

    Figure 1B: Detection of DNA-damage foci (green spots) with 53BP1 antibody staining and detection of cells in S-phase with EdU staining (red nuclei).

    For the experiment, the clear-cell renal carcinoma cell line SLR22 (more info) was used in standard 2D cell culture. Cells were plated on a 96-well imaging plate (Falcon 353219) 48 hours prior to drug treatment (5000 cells / well) in standard complete DMEM cell culture medium.

    For drug treatment, a genotoxic drug was used in a dilution series from 7.8nM to 2000nM and a mock control. Cells were incubated for 48 hours with the drug. 30 minutes prior to fixation, the base analogon EdU (Invitrogen C10419) was added in order to incorporate into newly synthesized DNA (marker for S-phase). Cells were then fixed with 4% PFA.

    For the detection of DNA-damage foci, the samples were then stained with an antibody against 53BP1 (Abcam ab175933), which is a DNA-repair regulator residing in DNA-damage foci. For the detection of EdU, we followed the staining protocol provided by the manufacturer. Finally, DAPI was added to stain nuclei and micronuclei. Fig. 1B shows the morphological appearance of these stains in microscopy.

    Images were acquired with ZEISS Axio Observer employing a 20X objective. From every well, 4x4 tiles were acquired and stitched directly using ZEISS ZEN (blue edition). These stitched images were then exported to ZEISS arivis Pro for image analysis. In fact, the image processing pipeline in this story uses relatively little image processing; however, it makes strong use of the combinatorial filtering functions available in ZEISS arivis Pro.

    ZEISS arivis Pro
    arivis logo

    ZEISS arivis Pro

    ZEISS arivis Pro  is a modular software for working with multi-channel 2D, 3D and 4D images of almost unlimited size, highly scalable and independent of local system resources. Many modern microscope systems such as high-speed confocal, light sheet / SPIM, super-resolution, electron microscopy or X-ray instruments can produce huge amounts of imaging data. ZEISS arivis Pro handles such datasets without constraints and in relatively short time.

    Software Processing

    Image Analysis Procedure
    Image Analysis Procedure

    Image Analysis Pipeline

    In a first step, both DAPI and 53BP1 channels were background subtracted to remove any background that might interfere with the detection of micronuclei, nuclei and DNA-damage foci. Especially micronuclei and DNA-damage foci especially can have small sizes and low intensities, making them hard to segment without good pre-processing

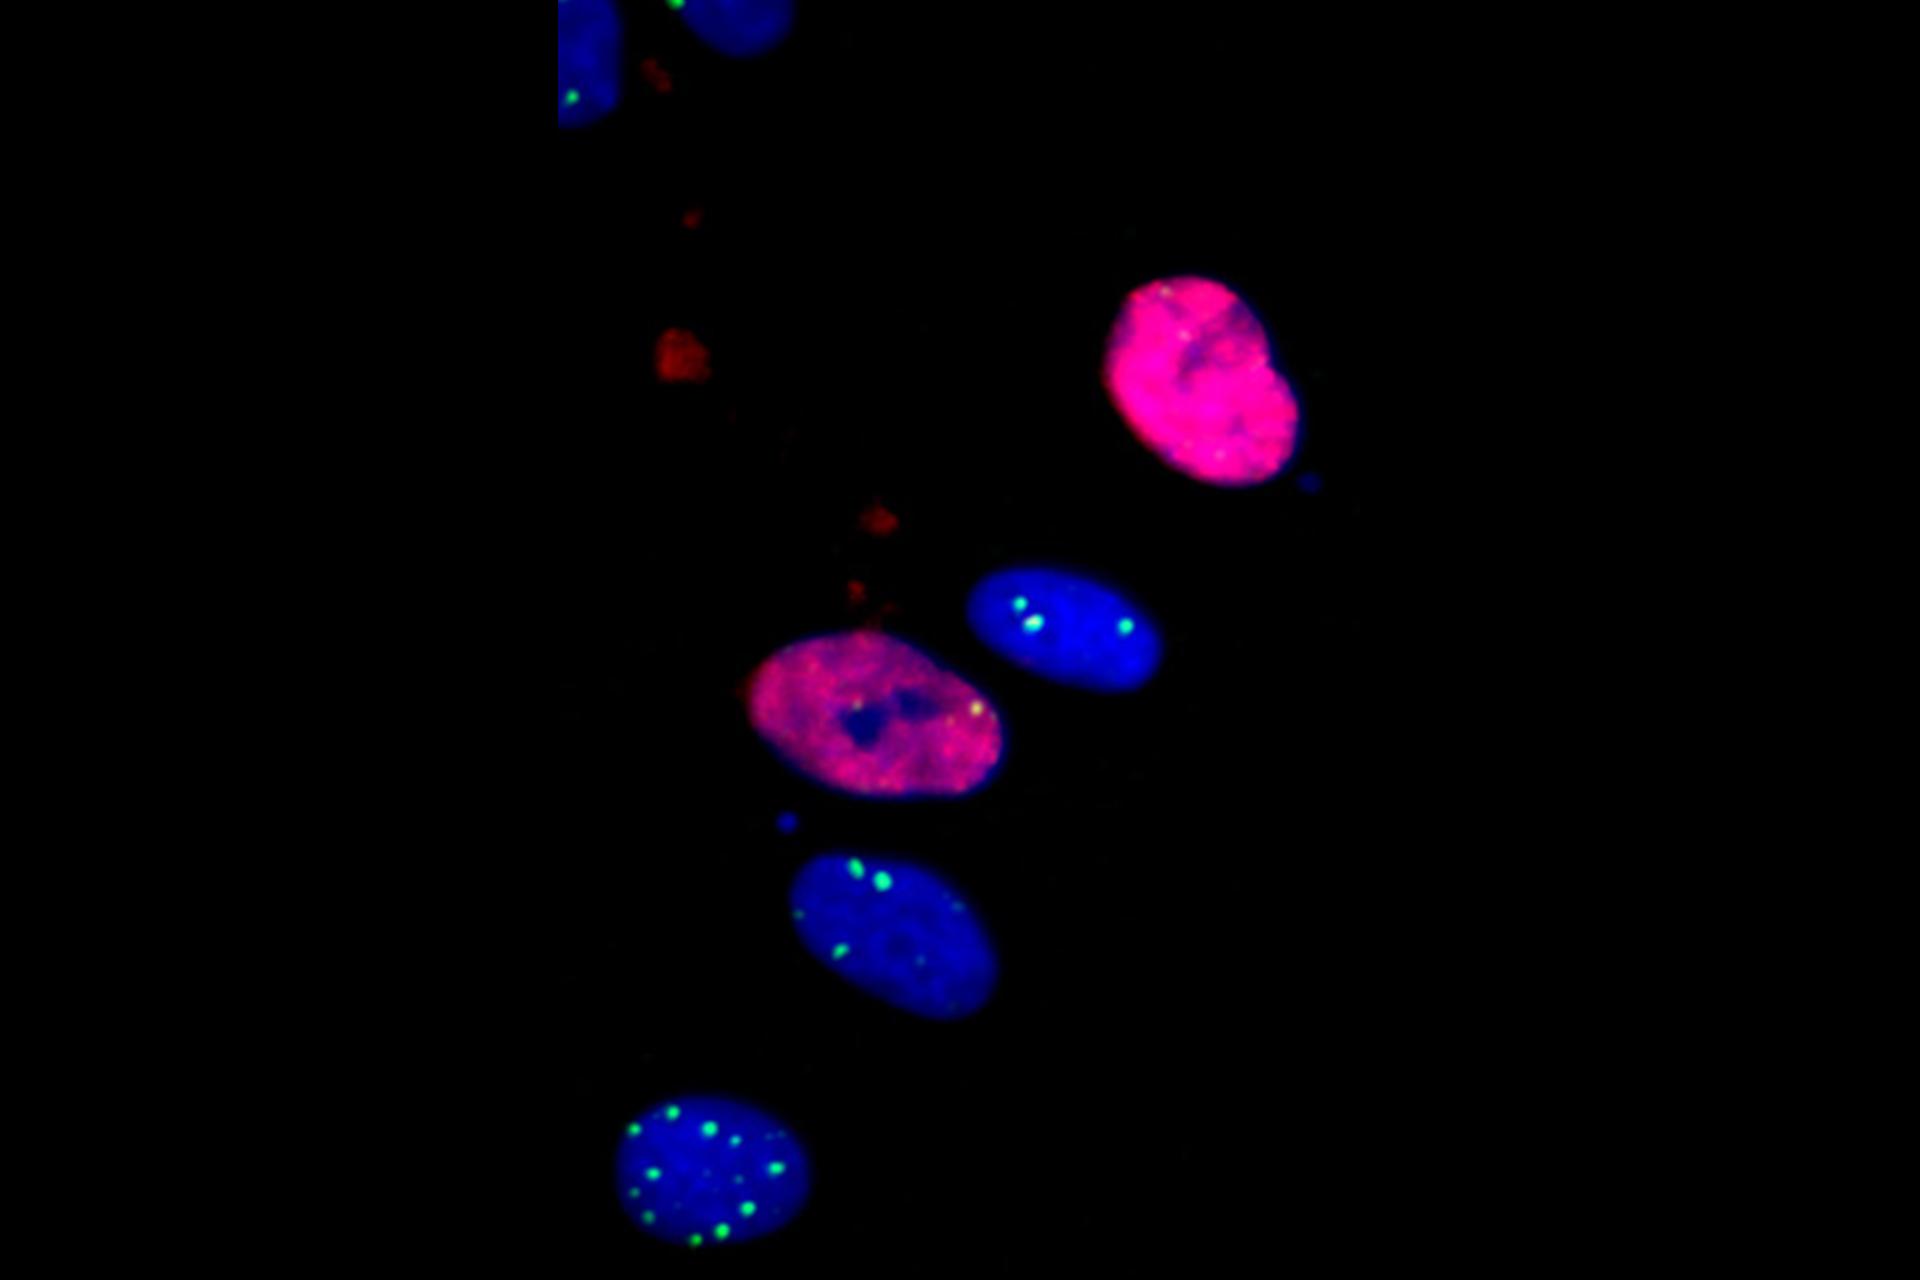
    In the DAPI channel, we next detected both nuclei and micronuclei via watershed segmentation and separated both object groups by size and intensity (micronuclei are a factor of 100 smaller and are less intense than nuclei). The distance function was used to determine the distance from nuclei to the nearest micronucleus, which allowed later stratification of nuclei into micronucleus-positive and -negative fractions based on a distance cutoff.

    By employing cut-off filters for DAPI and EdU channel intensity, nuclei were then further separated into three cell cycle phases: G0/G1 phase nuclei with DAPIlow/EdUlow total nuclear intensities, S-phase nuclei with EdUhigh and G2/M phase nuclei with DAPIhigh/EdUlow.

    DNA-damage foci were derived also with watershed segmentation. Nuclei and raw foci were set into parent-child relationship by the compartment operation. This ensured that only DNA-damage foci within segmented nuclei were considered and allowed later stratification of DNA-damage foci along cell cycle phases.

    This complete image processing pipeline is available under “Pipeline.xml” (part of the case study files download at the end of the webpage). We invite you to download a free trial of ZEISS arivis Pro and experience it in the software. Find all links at the bottom of this page.

    Validation

    Figure 2A: Representative clip of data set with identified objects as bounding boxes
    Figure 2A: Representative clip of data set with identified objects as bounding boxes

    Figure 2A: Representative clip of data set with identified objects as bounding boxes; Note that nuclei (blue arrows), micronuclei (red arrows) and DNA-damage foci (green arrows) are reliably segmented.

    Figure 2A: Representative clip of data set with identified objects as bounding boxes; Note that nuclei (blue arrows), micronuclei (red arrows) and DNA-damage foci (green arrows) are reliably segmented.

    Correct Object Detection and Cell Cycle Distribution

    A simple method for validating the segmentation results is visual inspection. As shown in Figure 2A, the segmentation strategies for nuclei (blue arrows), micronuclei (red arrows) and DNA-damage foci (green arrows) produced acceptable results. Nuclei were sufficiently separated by the watershed algorithm. Micronuclei and DNA-damage foci of small size and intensity also were detected reliably.

    Figure 2B: Scatter plot of single cells based on their total intensities of EdU and DAPI channels

    Figure 2B: Scatter plot of single cells based on their total intensities of EdU and DAPI channels. Note the expected pattern for different cell cycle phases.

    To validate the correct separation of nuclei into cell cycle phases, we plotted EdU total nuclear intensity versus DAPI total nuclear intensity to obtain the characteristic cell cycle distribution of dividing cells (Figure 2B).

    Results

    Figure 3D: Dose-response curve with logarithmic scale

    Figure 3A: Dose-response curve with logarithmic scale; curve from sigmoid curve fit; IC50 = 146.5 nM.

    Cytotoxic Efficacy

    The first and most important read-out for drug testing in oncology is determining the dose-response curve. Low concentrations of a drug typically are tolerated and do not affect the cell proliferation, while doses beyond a certain threshold will kill most cells in a culture. This leads to a dose-response curve with a characteristic sigmoidal shape. The center of this distribution marks the point, where the population is reduced to 50%. This point is typically called “Inhibitory Concentration 50” (IC50) and is a characteristic measure for a drug to describe its cytotoxic efficacy.

    In this dataset, determining the dose-response curve can be done simply by determining total numbers of nuclei per sample. This can be obtained in ZEISS arivis Pro using the Object Manager and by creating group statistics. To obtain a suitable curve fitting, cell numbers were extracted and analyzed with a statistical software (Figure 3A). In this data set, the IC50 was 146.5 nM, which is a quite potent cytotoxicity. Note also, that the change in survival occurs quite abruptly. Cells are largely unaffected by the drug at 75 nM, but die at 250 nM. These concentrations will serve as reference points for the following discussions.

    2D slice view on data set with vesicles​

    Figure 4A: 2D slice view on data set with vesicles​

    2D slice view on data set with vesicles​

    Figure 4A: 2D slice view on data set with vesicles​

    Figure 4A: 2D slice view on data set with vesicles​

    DNA-damage Focus Intensities and Micronucleus Formation

    The drug under evaluation is a genotoxic drug. This means the drug induces small-scale and large-scale genetic defects, in the shape of DNA-double strand breaks and micronuclei respectively (Figure 4A). Within this dataset we have identified both single DNA-damage foci and micronuclei, and as a first step, focus and micronucleus numbers can be plotted vs. the drug dose (Figure 4B/C).

    Based on the dose-response and cytotoxicity determined above, the intuitive expectation for micronucleus and DNA-damage formation would be: the higher the dose, the higher the damage. Surprisingly, this is not the case. Micronucleus formation peaks at intermediate doses around the IC50 (Figure 4B), and there is also significant micronucleus formation at doses that are compatible with cell proliferation (31 – 125nM). The number of DNA-damage foci, on the other hand, follows a dose response relationship (Figure 4C). But, DNA-damage foci can have a large variation in sizes and intensity. When taking into account only focus intensities, the maximum response occurs at intermediate doses (Figure 4D). The next sections explain, how this is related to the drug effector mechanism and to the cell cycle.

    Figure 4B: Micronuclei according to drug dose; normalized for cell counts (according to Figure 3D).

    Figure 4C: Number of DNA-damage foci according to drug dose; normalized for cell counts (according to Figure 3D).

    Figure 4D: DNA-damage intensity / cell according to drug dose.

    Relative cell-cycle distribution depending on drug dose

    Figure 5A:  Relative cell-cycle distribution depending on drug dose.

    Cell-cycle Dependent DNA-damage Elucidates Mode of Cell Killing

    Cell proliferation has a major influence in the efficacy of genotoxic drugs, as DNA is more vulnerable in the DNA synthesis phase (S-phase) or during mitosis. To approach a deeper mechanistic understanding of the genotoxic effects in this data set, it is worth taking cell-cycle phases into account. The first plot simply shows the cell cycle distributions in each sample (Figure 5A). High doses (>250 nM) cause the fraction of actively cycling cells (S / G2 / M phase) to increase from 15-20% to 40-50%. This is at first glance puzzling, because other types of genotoxic treatments (e.g. ionizing irradiation) instead cause proliferative arrest which leads to higher fractions of G0/G1 cells.

    To evaluate this further, we also checked DNA-damage formation in different cell-cycle phases (Figure 5B-D). High focus numbers occur specifically at high drug doses in S-phase and G2/M-phase. Hence, high amounts of DNA-damage impair these cells in S- and G2/M-phase and prevent them from completing the cell-cycle, with a larger fraction of cells is in these phases. In fact, this was confirmed by another experiment not included here (by measuring replication speed). In summary, we observe very clear indications that the genotoxic drug is in fact a drug specifically acting on dividing cells, with the major driving force for cytotoxicity being the overwhelming accumulation of DNA-damage in these phases.

    Figure 5B: DNA-damage foci numbers in G0/G1-phase.

    Figure 5C: DNA-damage foci numbers in S-phase.

    Figure 5D: DNA-damage foci numbers in G2/M-phase.

    Mechanisms of micronucleus formation during mitosis

    Figure 6A: Mechanisms of micronucleus formation during mitosis

    High-intensity Foci and Micronuclei Form in G0/G1 Phase

    The previous section essentially elucidated the main mode of cell killing. However, there remain important questions about the full mechanistic details: Why do most micronuclei and particularly intense DNA-damage foci occur at intermediate doses (Figure 4B and D)? And how does damage inflicted during DNA synthesis (S-phase) influence occurrences of micronuclei and intense DNA-damage?

    To approach this question, we can examine DNA-damage focus intensities in cells of different cell cycle phases (Figure 6B-D). It becomes apparent that large-intensity DNA-damage foci mainly form in the G0/G1 phase.

    Micronuclei form because of different chromosomes being covalently linked by repair mismatches or chromosome fragments that haven’t been properly repaired (Figure 6A). These chromosomes then fail to segregate into daughter cells during mitosis. This suggests that micronuclei also should accumulate in G0/G1-phase. To validate this notion in this dataset, cells with a micronucleus at less than 20µm distance were assigned as “MN-positive” and compared with the rest of the cells (Figure 6E). This plot shows higher fractions of MN-positive cells in G0/G1-phase in the dose range of 125 – 500 nM.

    Figure 6B: Average single focus intensities in G0/G1-phase cells, stratified for drug doses.

    Figure 6C: Average single focus intensities in S-phase cells, stratified for drug doses.

    Figure 6D: Average single focus intensities in G2/M-phase cells, stratified for drug doses.

    Average single focus intensities in G2/M-phase cells, stratified for drug doses

    Figure 6E: Average single focus intensities in G2/M-phase cells, stratified for drug doses

    Both intense DNA-damage foci and micronuclei only form after (S-phase damage) cells passage through mitosis. This explains why this phenomenon is restricted to intermediate doses. For higher doses, cells completely fail to complete mitosis, hence no micronuclei and high-intensity DNA-damage foci are able to form.

    Large DNA-damage foci, as opposed to small foci, form at genomic sites with complex DNA-damage (e.g. consisting of several double-strand breaks or involving multiple chromosomes) that cannot be repaired easily. Such damage is to be expected during micronucleus formation. This provokes the question of whether large DNA-damage foci and micronuclei are two consequences of the same process. To analyze this, the correlation of micronuclei and large DNA-damage foci was determined at a single cell level. Cells were first separated into MN-positive and MN-negative groups; the average of the most intense DNA-damage foci per cell was plotted (Figure 6F). Then, cells were stratified according to their most intense DNA-damage focus and the MN-positive cell fraction was plotted (Figure 6G). Both plots show that cells with high DNA-damage focus intensities (> 200000) also show the highest fraction of MN-positive cells. An example of how both phenomena co-occur is shown in Figure 6H.

    Figure 6F: DNA-damage focus intensity in MN-positive vs. MN-negative cells, additionally stratified for cell cycle phases.

    Figure 6G: Fraction of MN-positive cells in cells stratified for their most intense DNA-damage focus.

    Figure 6H: High-intensity foci and micronuclei co-occur on a single-cell level.

    Summary of drug effector mechanisms

    Figure 7: Summary of drug effector mechanisms

    Summary of drug effector mechanisms

    Figure 7: Summary of drug effector mechanisms

    Figure 7: Summary of drug effector mechanisms

    Mechanistic Interpretation of Results

    To finalize the story, we now combine all observations into a mechanistic understanding of the drug effects (Figure 7). After DNA-damage induction in S-phase, two types of cell fates can be observed. For cytotoxic drug doses, a high fraction of cells remain in cycling phases S and G2/M. Simultaneously, there is a large number of S- and G2/M-phase-specific DNA-damage foci. Hence, at high doses, the DNA-damage overwhelms the DNA repair capacity, leading to cells undergoing cell-cycle arrest and eventually cell death. This cell fate is the main route of drug toxicity.

    At intermediate drug doses, less DNA-damage foci are accumulating in S- and G2-phases, these phases are not prolonged, and cells can successfully complete their cell division. However, mistakes in DNA-damage repair lead to secondary damage during mitosis. This damage is observed in G0/G1-phase in the shape of micronuclei and complex, high-intensity DNA-damage foci. While this cell fate does not directly contribute to drug toxicity, it may contribute in various ways to the success or failure of a drug treatment in oncology. The chronically damaged cells displaying mutations and aneuploidy may contribute to drug resistance. Conversely, the damage may make cells susceptible to synergistic combination drug treatments or cause inflammatory

    Summary

    With this application example we demonstrated an in-depth mechanistic analysis of genotoxicity. We showed that  ZEISS arivis Pro is a flexible tool for conducting a complex analysis of a dataset along diverse parameters.

    Key to this type of analysis was the capacity of  arivis Pro to allow the generation of different relationships between object groups. In the course of the analysis, we classified nuclei: (a) based on nuclear signal intensities (to determine the cell cycle), (b) based on intranuclear DNA-damage foci that were assigned to nuclei by a parent-child object relationship, and (c) based on nearby micronuclei, that were assigned to nuclei based on their distance.

    This allowed fast and flexible stratification of nuclei suitable for quantifying the scientific questions and observations that came up during the course of analysis. Together with the automatic pipeline that documents image processing steps and allows later reuse, you’ll find the optimal design of workflow guidance and interactive data exploration in arivis Pro.

    In addition, with the recent development of the VisionHub web-based platform, it was possible to scale up the analysis of the study for high-throughput, server-side analysis of all images captured from the multi-well plates. This significantly reduced the analysis time while also making the results readily available online to share with colleagues.
    Data set and image processing pipeline are available in the end of this section, and we invite you to test it for yourself and analyze it further. Or perhaps study it as a blueprint for your own dataset.


    Share this article