Whole Slide Imaging of the Pancreas to Study Type 1 Diabetes
Researchers investigate interferon sensors in the islets of Langerhans using automated, whole slide imaging for the study and analysis of pancreas pathology.
Type 1 diabetes is a chronic autoimmune disease in which the pancreas produces little or no insulin. Insulin is a hormone needed to allow sugar to enter cells to produce energy. The exact cause of type 1 diabetes is unknown. Usually, the body’s own immune system mistakenly destroys the insulin-producing cells (called beta cells) in the islets of Langerhans of the pancreas.
Dr. Teresa Rodriguez-Calvo of the Institute of Diabetes Research (Helmholtz Zentrum München), Germany, heads a lab focused on increasing our understanding of the immunopathogenesis of human type 1 diabetes in order to develop novel therapies aimed at increasing insulin secretion and stopping the autoimmune attack.
Interferon Sensors in the Islets of Langerhans in Type 1 Diabetic Subjects
Interferon Sensor and Insulin Expression Investigated with Whole Slide Imaging using ZEISS Axioscan
The islets of Langerhans from a non-diabetic donor showing normal HLA-I expression (top), and a type 1 diabetic donor with high expression of the interferon sensor HLA-I (bottom). Scale bars are 100 μm. Image collected using automated whole slide scanning with ZEISS Axioscan.
The islets of Langerhans from a non-diabetic donor showing normal HLA-I expression (top), and a type 1 diabetic donor with high expression of the interferon sensor HLA-I (bottom). Scale bars are 100 μm. Image collected using automated whole slide scanning with ZEISS Axioscan.
Investigating Interferon Sensors in the Islets of Langerhans
In P.S. Apaolaza et al., they show that interferon sensors are expressed in the islets of Langerhans in type 1 diabetic subjects and at risk-individuals. An interesting observation is that in diabetic individuals, these interferon sensors are predominantly detected in islets that still contain insulin, but their expression is associated with the downregulation of multiple genes in the insulin secretion pathway, indicating a potential functional defect of the remaining insulin-producing beta cells. The expression of these interferon sensors is also more abundant in islets with high immune infiltration, suggesting that they are contributing to the inflammatory environment of the islet and they might exacerbate the immune response.
They also observed a positive correlation of these sensors with the presence of a protein from the capsid of enteroviruses, which suggest that they might be induced in response to viral infections, as would be expected for interferon responses.
We believe that our study highlights the importance of interventions that prevent or eliminate viral infections and also supports the use of therapeutic agents that could diminish interferon-induced inflammation in individuals with type 1 diabetes. One of our future goals is to further characterize these innate immune responses and to study how the immune system recognizes viral as well as self-antigens during the course of type 1 diabetes.
Pancreas
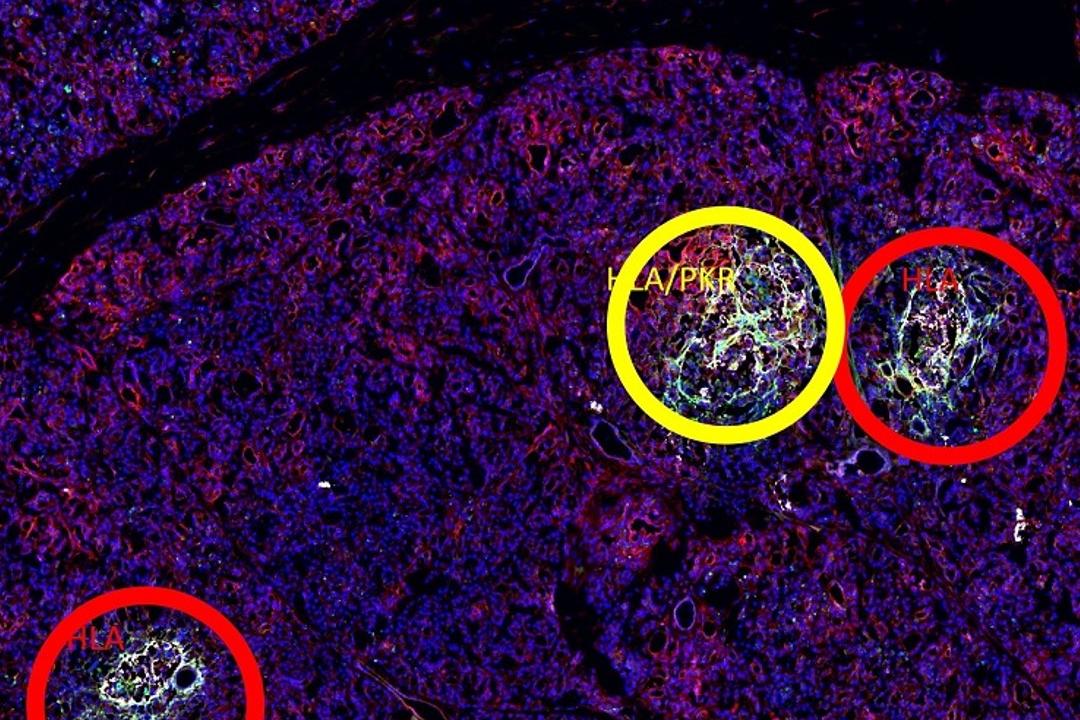
Upper inset
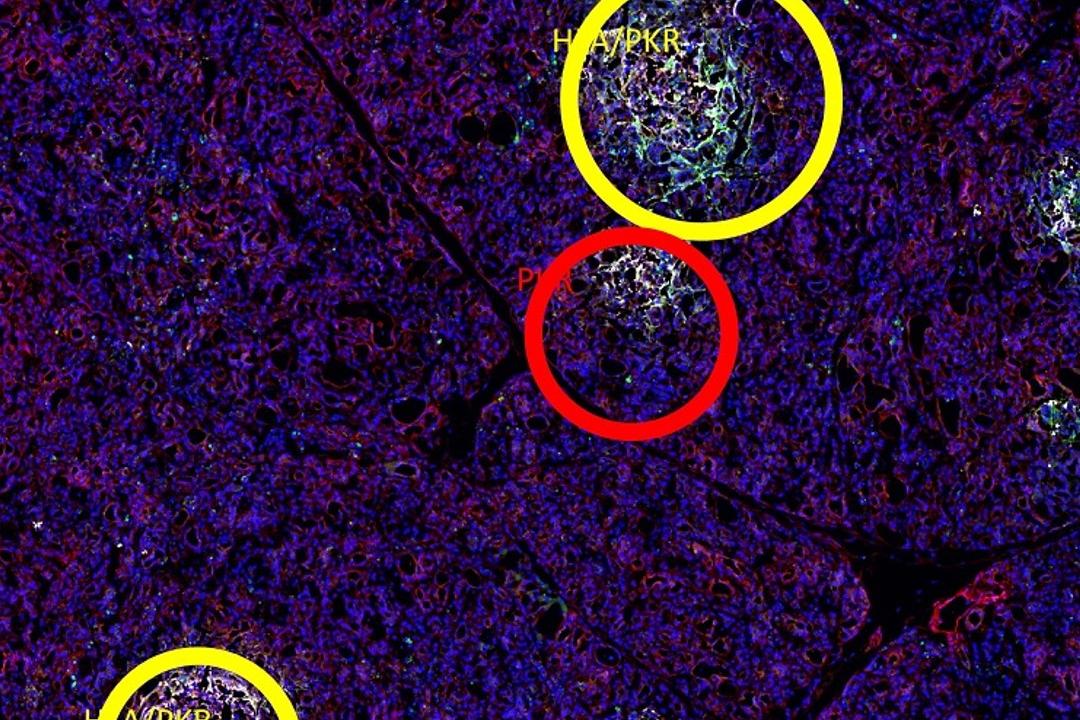
Center inset
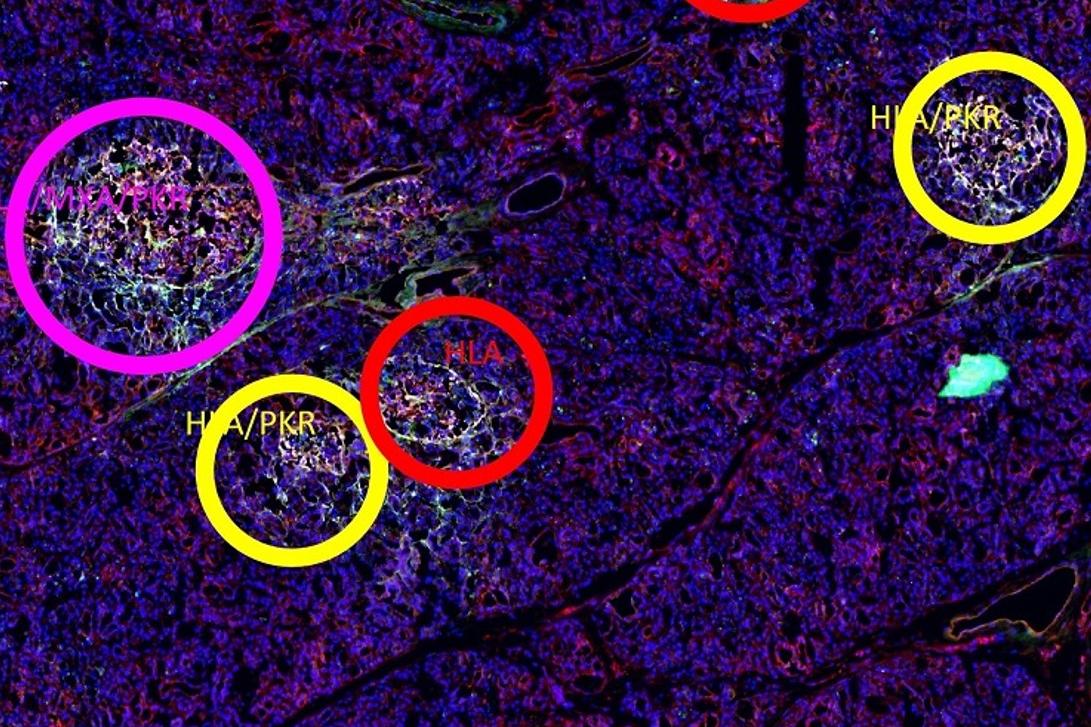
Lower inset
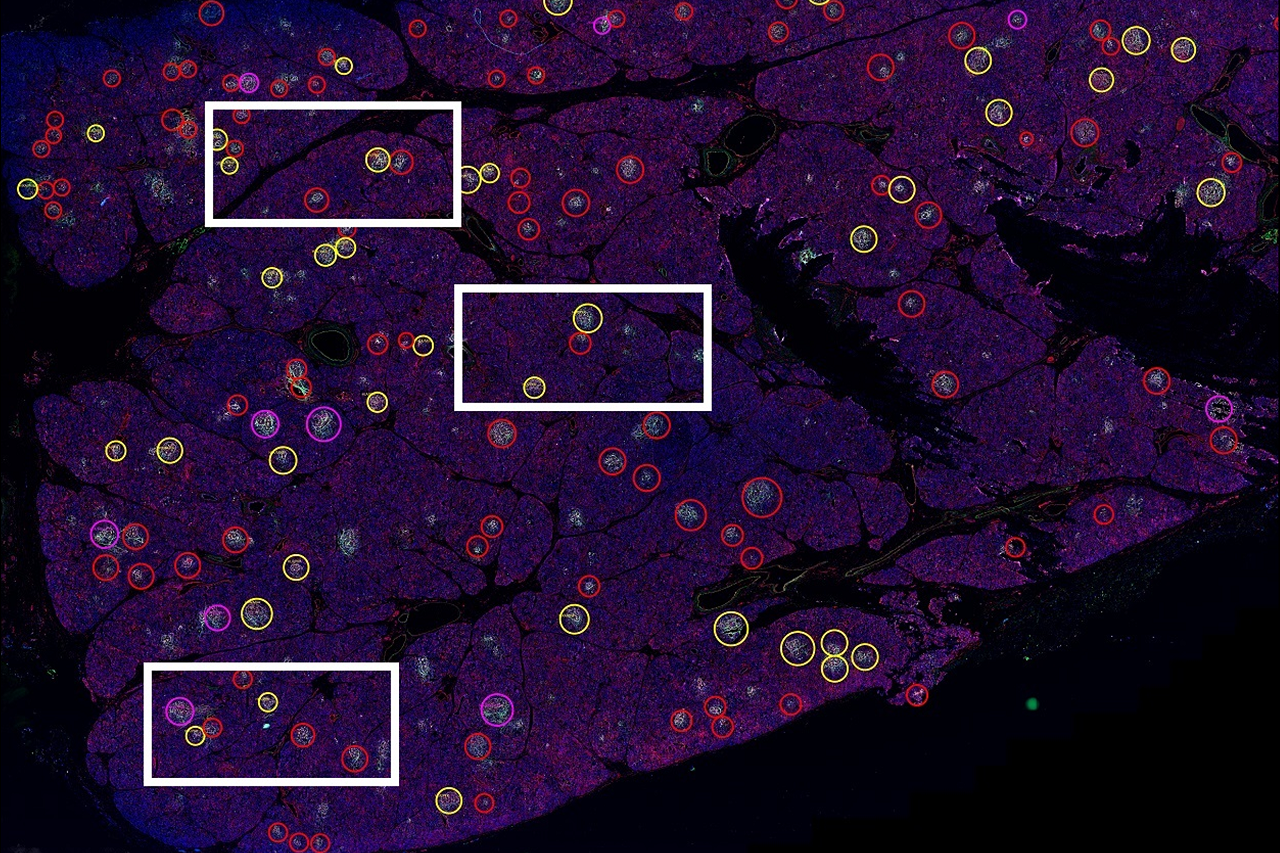
A whole pancreatic tissue section. Each positive islet was assigned a colored circle based on the number of expressed interferon response markers as follows: red for the expression of one marker, yellow for two markers, purple for three markers, and blue for four markers. Scale bar is 290 microns.
A whole pancreatic tissue section. Each positive islet was assigned a colored circle based on the number of expressed interferon response markers as follows: red for the expression of one marker, yellow for two markers, purple for three markers, and blue for four markers. Scale bar is 290 microns.
Upper inset
Upper inset
Center inset
Center inset
Lower inset
Lower inset
Whole Slide Imaging of Pancreas Pathology
Dr. Rodriguez-Calvo stated: "One of the biggest challenges in the study and analysis of pancreas pathology is the heterogeneity of the human pancreas, which is evident at multiple levels."
In their recent study, pancreas whole tissue sections were imaged using ZEISS Axioscan. The numbers of insulin- and glucagon-positive islets, as well as the presence of interferon-associated molecules like HLA-I, MxA, PKR, and dsRNA, were assessed manually.
For other parts of the project, they used an open-source software for digital pathology and whole-slide image analysis as described by P. Bankhead et al. Dr. Rodriguez-Calvo's team has also published an article describing whole-slide imaging analysis of the pancreas using ZEISS Axioscan and QuPath (P.S. Apaolaza et al.).
Overall, whole-slide imaging is essential for the study of the pancreas and of type 1 diabetes. Understanding and characterizing the large heterogeneity and the changes that we observe in the pancreas during disease progression, even within an individual, is greatly needed in order to move towards successful therapeutic and preventive strategies in diabetes.


, and a type 1 diabetic donor with high expression of the interferon sensor HLA-I (bottom). Scale bars are 100 μm. Image collected using automated whole slide scanning with ZEISS Axioscan.")
, and a type 1 diabetic donor with high expression of the interferon sensor HLA-I (bottom). Scale bars are 100 μm. Image collected using automated whole slide scanning with ZEISS Axioscan.")
, Germany")
, Germany")
, Germany")