Volume EM with Serial Block-Face Scanning Electron Microscopy
Volume EM Techniques

Serial Block-Face SEM

Highly Automated Sectioning and Volume Data Imaging​

  • Easy sample preparation
  • Highly automated image acquisition
  • Higher Z-resolution than array tomography
  • Superb image resolution at low voltages

Volume EM with Serial Block-Face SEM (SBF-SEM)

With an ultramicrotome located inside the SEM chamber, a resin-embedded sample can be automatically imaged and cut until the desired – or entire – stack is acquired in the Z direction of the sample. The Z-step size ranges from 15 to 30 nm. Serial block-face SEM (SBF-SEM) is a technology of choice when the user is interested in easy sample preparation, a highly automated imaging process, and a higher Z-resolution than what is found with array tomography.

With ZEISS Focal Charge Compensation, the technique is more robust and can also be used for charge prone samples which was only possible at the expense of image quality before: A tiny capillary needle is precisely located above the sample and nitrogen is guided through this needle directly onto the block face surface while the chamber is maintained under high vacuum. This eliminates charging without degrading image quality. Due to the decrease in charging while using Focal Charge Compensation, image quality is improved and drift, jitter and image distortions are reduced. These last effects eliminate the need for extensive registration of the resulting data sets.

Overall, Focal Charge Compensation allows to image more diverse samples in three dimensions without charging and at high resolution.

Schematic Representation of a Typical Workflow

Serial Block-Face SEM imaging

1

A resin-embedded sample is cut with an ultramicrotome mounted inside the SEM chamber. The exposed sample surface is imaged. This cutting and imaging process is repeated until the structure of interest is completely imaged.

Processing segmentation

2

The acquired EM images are processed and digitally aligned into a 3D data set. Cell compartments can be identified and segmented. ​

3D visualization analysis

3

The segmented 3D data set can be visualized, investigated, and statistically analyzed. ​

New Discoveries from the Ultrastructure of Life Virtual Seminar Series | January – June 2024

In a series of six webinars, explore the technological underpinnings of Volume EM imaging and its growing number of application areas in neurobiology, cancer research, developmental biology, plant science, and more.

Learn about vEM-specific sample preparation and technologies (array tomography, serial block-face SEM, and FIB-SEM), advanced image processing, data analysis, and result visualization capabilities of workflow-oriented software solutions.

Application Examples​

Understanding the Relationship between Structure and Function​

Mouse brain imaged with ZEISS Sigma with integrated ultramicrotome, stack of 75 images with 7 nm pixels. Microtome set to remove 15 nm/slice.

Mouse brain imaged with ZEISS Sigma with integrated ultramicrotome, stack of 75 images with 7 nm pixels. Microtome set to remove 15 nm/slice.

Mouse brain imaged with ZEISS Sigma with integrated ultramicrotome, stack of 75 images with 7 nm pixels. Microtome set to remove 15 nm/slice.

Imaging Ultrastructural Details of Neurons​

The brain is a complex organ with millions of neuronal connections and signaling pathways. Understanding the relationship between structure and function of brain tissue helps in unravelling some of this complexity to better understand how neural networks are organized and, in the long term, how to treat certain pathologies with medical interventions.  

Block face sample imaged at 2.5 keV, 1 μs pixel dwell time and high vacuum using Focal Charge Compensation device. Scale bar: 1 μm. Courtesy of NCMIR.

Block face sample imaged at 2.5 keV, 1 μs pixel dwell time and high vacuum using Focal Charge Compensation device. Scale bar: 1 μm. Courtesy of NCMIR.

Block face sample imaged at 2.5 keV, 1 μs pixel dwell time and high vacuum using Focal Charge Compensation device. Scale bar: 1 μm. Courtesy of NCMIR.

Imaging of Neurons in Cell Culture

SBF-SEM is the appropriate solution to image and follow neurons with long and thin protrusions such as dendrites and axons. Especially neurons in cell culture are difficult to image. The high proportion of the non-conductive resin makes the samples prone to charging. Focal Charge Compensation mitigates charging effects and ensures a high image quality. Ultrastructural details of neurons can be easily imaged and resolved with SBF-SEM in combination with Focal Charge Compensation.

The images show a single slice from a 3D data set of cultured hippocampal neurons expressing PSD95-APEX2 to stain post-synaptic densities (arrows). Images were acquired using a ZEISS FESEM, integrated ultramicrotome and Focal Charge Compensation. Ultrastructure such as thin dendrites and connections are visible with high resolution due to the removal of charging effects.

Courtesy of Prof. Mark Ellisman (University of California, San Diego)​

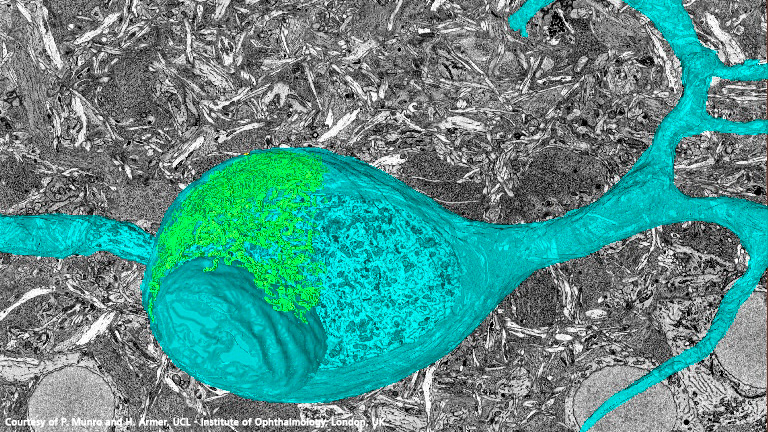
Single Neurons and Cellular Compartments in Mouse Brain Tissue​

The video shows the cross sections of a mouse brain specimen captured using Serial Block-Face SEM. The high resolution this approach provides can be clearly seen in each of the single block-face images. Single neurons and cellular compartments can be identified and followed along the z-dimension.

Investigation of Axon Myelinization to Understand Multiple Sclerosis and Parkinson’s Disease

  • Myelin lamellae
  • Single neurons and cellular compartments in mouse brain tissue​
  • Electron micrographs provide high resolution information sufficient to count the number of single myelin lamellae and measure overall sheath thickness.
    Myelin lamellae Courtesy of NCMIR.
    Courtesy of NCMIR.

    Courtesy of NCMIR.

    Electron micrographs provide high resolution information sufficient to count the number of single myelin lamellae and measure overall sheath thickness.

    The sparse nature of structures in these samples leads to significant charging effects. Using Focal Charge Compensation eliminates these effects – you can now image with highest resolution in all three dimensions. ​

  • Courtesy of NCMIR.

    The animation shows a run through single slices (x-y) of rat spinal cord using 3View® and Focal Charge Compensation. Single lamellae within the myelin sheaths of the axons are clearly visible as well as microtubules and other cellular organelles

Contact ZEISS Microscopy

Contact

Form is loading...

/ 4
Next Step:
  • Step 1
  • Step 2
  • Step 3
Contact us
Required Information
Optional Information

If you want to have more information on data processing at ZEISS please refer to our data privacy notice.