ZEISS Lightsheet 7​
Product

ZEISS Lightsheet 7

Light-Sheet Multiview Imaging of Living and Cleared Specimens

Light sheet fluorescence microscopy (LSFM) is ideal for fast and gentle imaging of whole living model organisms, tissues and cells as they develop – over extended periods of time. What’s more, use ZEISS Lightsheet 7 to image large optically cleared specimens in toto – with subcellular resolution. Dedicated optics, sample chambers and holders allow adaption to the refractive index of your chosen clearing method.

  • Observe real life – fast and sensitively.
  • Image large specimens in your preferred clearing solution.
  • Get best image quality for various applications.
Development of Arabidopsis flowers. Courtesy of Riha lab, CEITEC, Masaryk University, Brno, Czech Repu

Observe Live Processes 

Fast and Sensitively

High quantum efficiency detectors enable observations of the fastest processes at the lowest illumination light levels. You'll get a real-life view of your samples without the adverse effects of excitation light on their biology. A special sample chamber provides heating, cooling and CO2 to maintain the perfect environment for your experiments.

Caption:  Development of Arabidopsis flowers. Courtesy of Riha lab, CEITEC, Masaryk University, Brno, Czech Repu

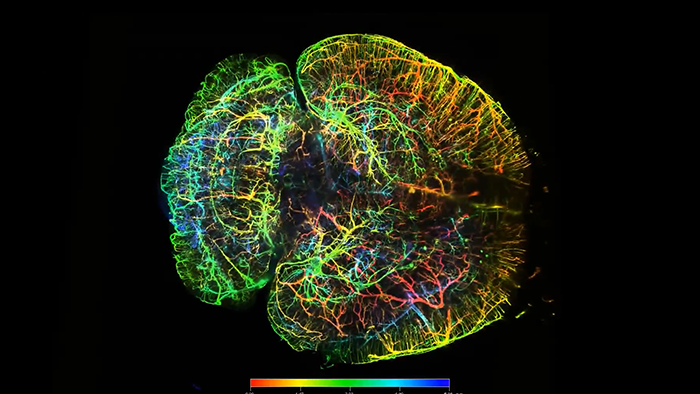
Image Large Specimens

In your Preferred Clearing Solution

Which optical clearing method you choose will depend on the tissue, your fluorescent labels, and the size of the sample. Lightsheet 7 is designed to match all these conditions. Image specimens at up to 2 cm in size at any refractive index between 1.33 and 1.58, and in almost all clearing solutions. Acquire overview images and data with subcellular resolution – whether you work with optically cleared organoids, spheroids, organs, brains or other specimens.


Video: C57 BL6J mouse perfused with PBS, CellTracker™ CM-DiI Dye, and 4% PFA. Cleared using iDISCO+ protocol, final RIMS is Ethyl Cinnamate. Sample Courtesy of: Erin Diel – Harvard University; Harvard Center for Biological Imaging Room 2052, 16 Divinity Ave, Cambridge, MA 02138, USA

Dedicated optics for your ZEISS Lightsheet 7

Achieve Best Image Quality

For Diverse Applications

Take your LSFM imaging a step further to tackle a broad range of applications. Special optics and sample chambers let you adjust to the perfect refractive index. Smart software tools help you adjust imaging parameters, such as light sheet and sample positions, zoom settings, tiles and positions, as well as data processing parameters. Add the patented Pivot Scan technology and get artifact-free optical sections with best image quality.

Take a Look Inside ZEISS Lightsheet 7

  • See how easy it is to position and image your living or cleared samples.

The Principle of Light Sheet Fluorescence Microscopy​

Lightsheet 7 LSFM illumination principle

The Principle of Light Sheet Fluorescence Microscopy​

The de-coupling of the detection optics from the illumination optics enables fluorescence excitation with dedicated lenses at low numerical aperture, without sacrificing detection resolution and sensitivity. This makes LSFM ideal for imaging of samples at the millimeter scale, such as developing organisms or large cleared tissue samples.

The Principle of Light Sheet Fluorescence Microscopy​

LSFM splits fluorescence excitation and detection into two separate light paths, with the axis of illumination perpendicular to the detection axis. That means you can illuminate a single thin section of the sample at one time, generating an inherent optical section by exciting only fluorescence from the in-focus plane. No pinhole or image processing is required. Light from the in-focus plane is collected on the pixels of a camera, rather than pixel by pixel as, for example, in confocal or other laser scanning microscopes. Parallelization of the image collection on a camera-based detector lets you collect images faster and with less excitation light than you would with many other microscope techniques. This makes 3D imaging extremely fast and very light efficient.

The de-coupling of the detection optics from the illumination optics enables fluorescence excitation with dedicated lenses at low numerical aperture, without sacrificing detection resolution and sensitivity. This makes LSFM ideal for imaging of samples at the millimeter scale, such as developing organisms or large cleared tissue samples.

The Patented Pivot Scanner

Delivers Homogeneous Illumination​

The Patented Pivot Scanner Delivers Homogeneous Illumination​

When the light sheet is passing through the sample, some structures of the specimen, e.g., nuclei, will absorb or scatter the excitation light. This will cast shadows along the illumination axis, as you see in the left figure. This effect occurs in all fluorescence microscopes, but the illumination axis in light sheet fluorescence microscopy is perpendicular to the observation axis and so this effect is more obvious. ​

In Lightsheet 7, a patented Pivot Scanner alters the angle of the light sheet upwards and downwards during image acquisition. By altering the illumination angle, the shadows will be cast in different directions and excitation light will also reach regions behind opaque structures, as you see in right figure. This is a perfect way to acquire artifact-free images and to improve downstream processing and analysis steps.

Applications

ZEISS Lightsheet 7 at Work

  • Mouse kidney cleared with iDISCO, imaged in Ethyl Cinnamate with Lightsheet 7 detection optics 5x/0.16 foc.
  • Sample courtesy of U. Roostalu, Gubra, Denmark.
  • Sample courtesy of U. Roostalu, Gubra, Denmark.

Nephrology

Mouse kidney cleared with iDISCO protocol and imaged in ethyl cinnamate with ZEISS Lightsheet 7 detection optics 5× / 0.16 foc and Clr 20× / 1.0 nd = 1.53 (insert). The mouse was perfused with DyLight 594 conjugated tomato lectin to visualize vasculature and glomeruli (red). In green: auto-fluorescence to visualize tissue anatomy. 3D whole organ imaging and computational image analysis of glomerular size and number helps to gain a better understanding of the mechanisms of diverse kidney diseases, e.g. diabetic nephropathy. Processed with arivis Vision4D® on ACQUIFER HIVE.

  • 3D Data set of a P10 mouse trachea displaying the anatomical organization of mechanosensory nerve fibers.
  • 3D Data set of a P10 mouse trachea displaying the anatomical organization of mechanosensory nerve fibers.
  • Sample courtesy of P.-L. Ruffault, C. Birchmeier, Laboratory of Developmental Biology / Signal Transduction; A. Sporbert, M. Richter Advanced Light Microscopy; M. Delbrück, Center for Molecular Medicine, Berlin, Germany.
  • Sample courtesy of P.-L. Ruffault, C. Birchmeier, Laboratory of Developmental Biology / Signal Transduction; A. Sporbert, M. Richter Advanced Light Microscopy; M. Delbrück, Center for Molecular Medicine, Berlin, Germany.

Developmental Biology

3D Data set of a P10 mouse trachea displaying the anatomical organization of mechanosensory nerve fibers. Staining: DAPI, Collagen IV (Alexa 488 antibody), sensorial fibers (reporter strain expressing tdTomato, Alexa 555 antibody), neurofilament protein NF200 (myelinated s nerve fibers, Alexa 647 antibody).

The sample was cleared in PEGASOS (Jing et al:, 2018, Cell Research) imaged in BB-PEG at RI of 1.54 with 5× / 0.16 foc detection optics and Cl r 20× / 1.0 nd = 1.53 respectively. 5× magnification data set: pixel scaling 0.61 × 0.61 × 1.63 micron, 3×3 tiles, Zoom 1.5×, 1230 z-sections, volume 2.57 × 2.58 × 2 mm 20× magnification data set: pixel scaling 0.23 μm × 0.23 × 0.58 micron, 1×5 tiles, Zoom 1.0×, 4206 z-sections, volume 2.0 × 0.45 × 1.82 mm.

  • Sample courtesy of W. Masselink, Tanaka lab, Research Institute of Molecular Pathology, IMP. Image courtesy of P. Pasierbek, K. Aumayr, IMP BioOptics, Vienna, Austria.

Vertebrate Limb, Spinal Cord Regeneration

Salamanders have the remarkable capability to regenerate their limbs and spinal cords. Molecular genetics tools allow to identify the stem cells responsible for this complex regeneration, and the injury-responsive signals that initiate their proliferation.  This axolotl forearm has been cleared in ethyl cinnamate (Masselink, W. et al. Development 146, (2019)) and imaged with 5× / 0.16 foc detection optics at a refractive index of 1.57. The multi-tile data set was aligned, fused and rendered with ZEN imaging software and arivis Vision4D® software on an ACQUIFER HIVE data platform.

  • Sample courtesy of D. Reumann and J. Knoblich, IMBA, Vienna, Austria.

Neuronal Morphology

Imaging entire cells in the human brain is a task close to impossible, due to the tremendously sophisticated morphology of neurons and their spread throughout the entire organ. Organoids allow the recapitulation of the human brain to a certain extent, including the production of neurons from neuronal stem cell cultures. With ECi clearing, neuronal morphology can be studied from the local to global level, which opens up fascinating possibilities for the study of neuronal morphology in 3D.

35 day old neuronal organoids sparsely labeled with GFP/tdtomato (3% GFP and 3% tdtomato) imaged with Clr 20× / 1.0 nd = 1.53 objective.
Pixel scaling: 222 × 222 × 567 nm.
Image volume: 1.66 × 0.66 × 1.6 mm.

  • Cleared and imaged in Ce3D (Li et al. PNAS 163, 2017) at Refractive Index 1.49 (ph 7) with a ZEISS Lightsheet, 5x/0.16 objective (volume 2.5 x 2.5 x 1.6 mm)  The labels are yellow: GFP-CD8 T cells, cyan: B220 (B Cell Follicles, Alexa555), magenta: CD31 (Vasculature, Alexa647)
    Cleared and imaged in Ce3D (Li et al. PNAS 163, 2017) at Refractive Index 1.49 (ph 7) with a ZEISS Lightsheet, 5x/0.16 objective (volume 2.5 x 2.5 x 1.6 mm)  The labels are yellow: GFP-CD8 T cells, cyan: B220 (B Cell Follicles, Alexa555), magenta: CD31 (Vasculature, Alexa647) Joanna Groom, The Walter and Eliza Hall Institute of Medical Research, Australia
    Joanna Groom, The Walter and Eliza Hall Institute of Medical Research, Australia

    Cleared and imaged in Ce3D (Li et al. PNAS 163, 2017) at Refractive Index 1.49 (ph 7) with a ZEISS Lightsheet, 5x/0.16 objective (volume 2.5 x 2.5 x 1.6 mm)

    The labels are yellow: GFP-CD8 T cells, cyan: B220 (B Cell Follicles, Alexa555), magenta: CD31 (Vasculature, Alexa647)

    Sample Courtesy of Joanna Groom, The Walter and Eliza Hall Institute of Medical Research, Australia

Immunology

Imaging intact lymphoid organs in 3D allows to analyze and quantify the immune response to viral infection. T cells were transferred into wildtype host mice prior to harvest. The node was cleaned, fixed and cleared using Ce3D (Li et al. PNAS 163, 2017) prior to imaging at RI = 1.49 (ph 7) with a 5× / 0.16 detection optics (volume 2.5 × 2.5 × 1.6 mm). The image shows GFP labelled native CD8+ T cells (yellow), B cell follicles are stained using B220 (cyan) and the CD31 vasculature network (magenta).

  • C57 BL6J mouse perfused with PBS, CellTracker™ CM-DiI Dye, and 4% PFA. Cleared using iDISCO+ protocol, final RIMS is Ethyl Cinnamate.
  • C57 BL6J mouse perfused with PBS, CellTracker™ CM-DiI Dye, and 4% PFA. Cleared using iDISCO+ protocol, final RIMS is Ethyl Cinnamate.
  • Sample courtesy of E. Diel, D. Ric hardson, Harvard University, Cambridge, USA.
  • Sample courtesy of E. Diel, D. Ric hardson, Harvard University, Cambridge, USA.

Mapping Vasculature of Entire Mouse Brain

A C57 BL6J mouse was perfused with PBS and 4% PFA. The brain was stained perfusing Cell-Tracker™ CM-DiI Dye – a lipid dye to label the vasculature membranes. The sample was cleared using iDISCO+ protocol, equilibrated in ethyl cinnamate as final RIMS. It was then imaged in ethyl cinnamate at RI = 1.565 with detection optics Fluar 2.5× / 0.12 in a Translucence Mesoscale Imaging Chamber.

The high-resolution insert image on the right was acquired with Clr Plan-Neofluar 20× / 1.0 Corr nd = 1.53. Image volume is 13.1 × 13.1 × 6 mm at a pixel resolution of 1.83 × 1.83 × 6.77 μm. It was acquired in about 40 minutes in 4×4 tiles, 866 z-sections. Data volume is 93 GB.  Data processed with ZEN imaging software and arivis Vision4D®  on an ACQUIFER HIVE data platform.

  • Sample courtesy of E. Diel, D. Richardson. Harvard University, Cambridge, USA.

Mapping Interneurons and Purkinje Cells of Entire Mouse Brain

PV-tdtomato mouse brain was cleared using CLARITY protocol with final imaging done in EasyIndex at a refractive index of RI = 1.46.

Parvalbumin-Cre yielding expression of tdtomato - Parvalbumin is expressed in a population of interneurons throughout the brain and in Purkinje cells in the cerebellum. The whole brain data set was acquired on ZEISS Lightsheet 7 with detection optics 5× / 0.16 foc. Image volume is 11 × 20 × 8.8 mm at a pixel resolution of 0.91 × 0.91 × 5.35 μm (12028 × 22149 × 1621 voxels). It was acquired in 6×10 tiles, 1621 z-sections. Data volume is 1.2 TB (805 GB after stitching). Data was processed with ZEN imaging software and arivis Vision4D® on an ACQUIFER HIVE data platform.

Downloads

    • ZEISS Lightsheet 7

      Light sheet fluorescence microscopy for Multiview imaging of living and cleared specimens.

      File size: 8 MB
    • ZEISS Lightsheet 7

      Light sheet fluorescence microscopy for Multiviewimaging of living and cleared specimens.

      File size: 1 MB
    • How to Get Better Fluorescence Images with Your Widefield Microscope.

      A Methodology Review

      File size: 1 MB
    • ZEISS Lightsheet 7

      How to Get Best Images with Various Types of Immersion Media and Clearing Agents

      File size: 2 MB
    • ZEISS Lightsheet 7

      Aquisição de imagens Multiview de amostras vivas e clareadas

      File size: 24 MB

Contact ZEISS Microscopy

Contact

Form is loading...

/ 4
Next Step:
  • Step 1
  • Step 2
  • Step 3
Contact us
Required Information
Optional Information

If you want to have more information on data processing at ZEISS please refer to our data privacy notice.