Application Note

Unraveling the tonsils secrets: 3D Spatialomics reveal complex immune system interplay

Introduction

The pursuit of biological understanding often hinges on deciphering the intricate interplay of gene expression within the architectural context of tissues. Traditional gene expression analyses have served as foundational tools, quantifying mRNA abundance across entire tissue samples. However, this ‘bulk’ approach inherently sacrifices the critical spatial information that dictates cellular interactions and tissue function.

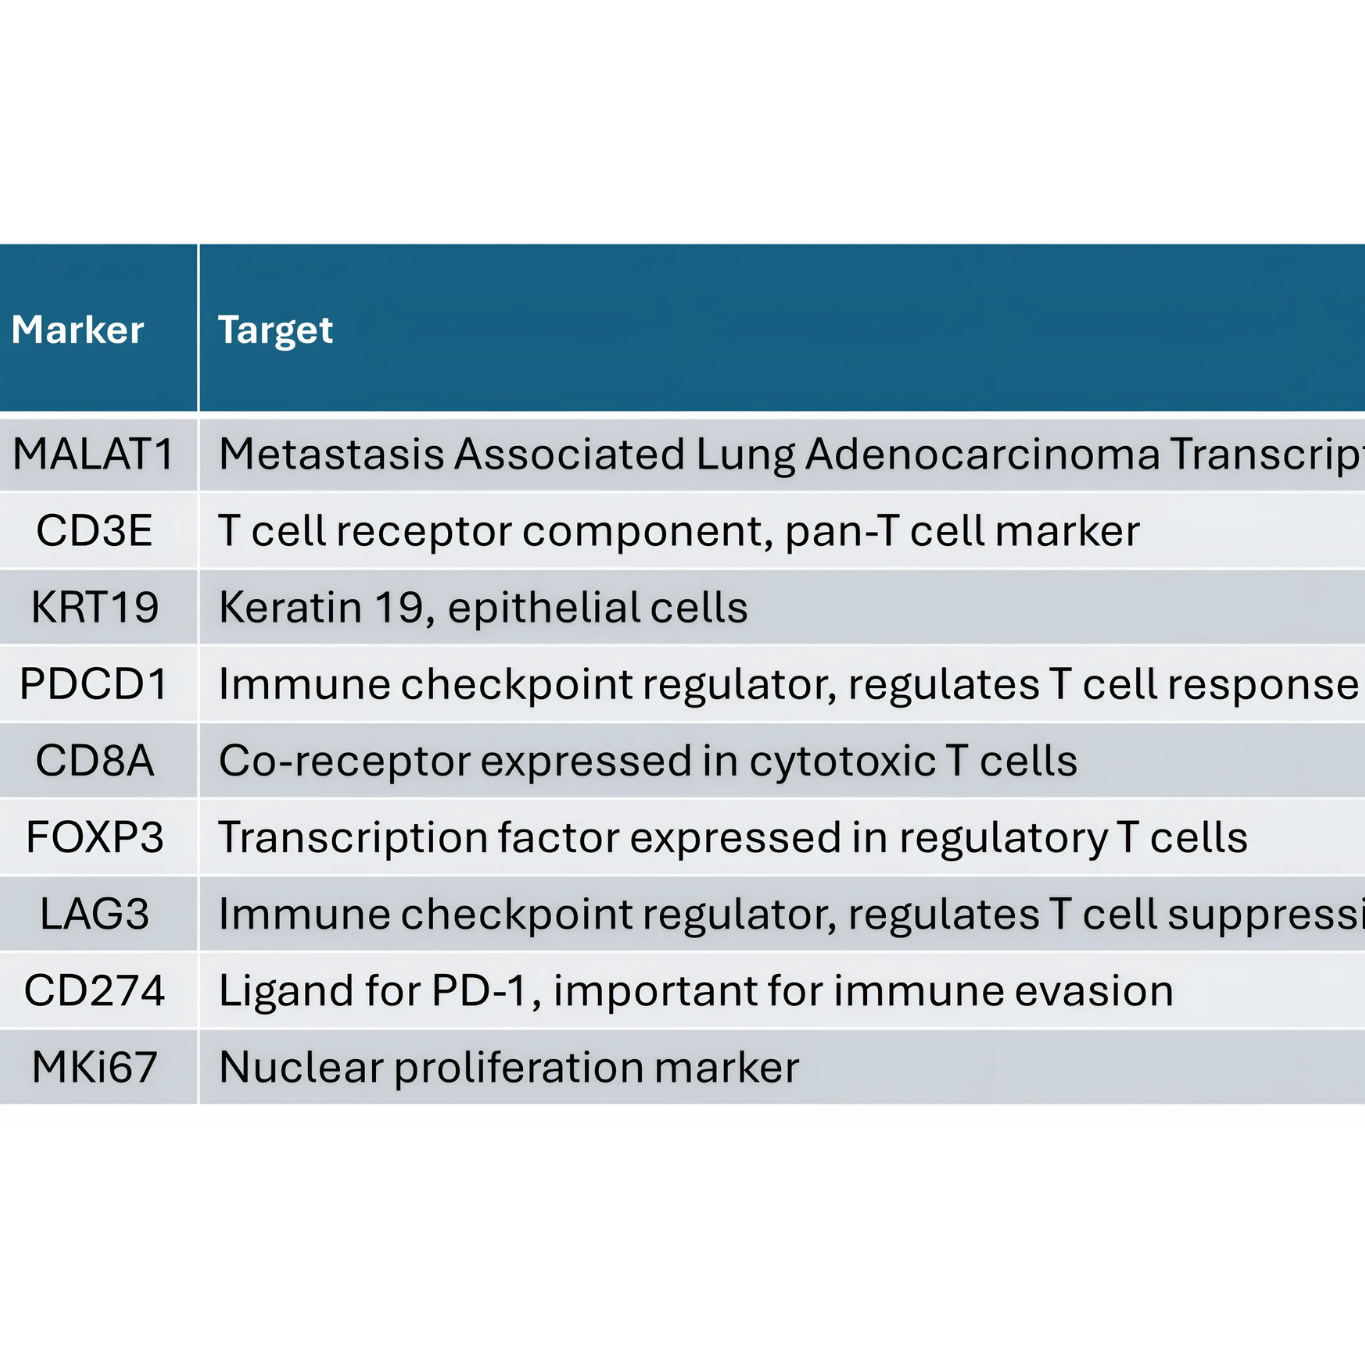
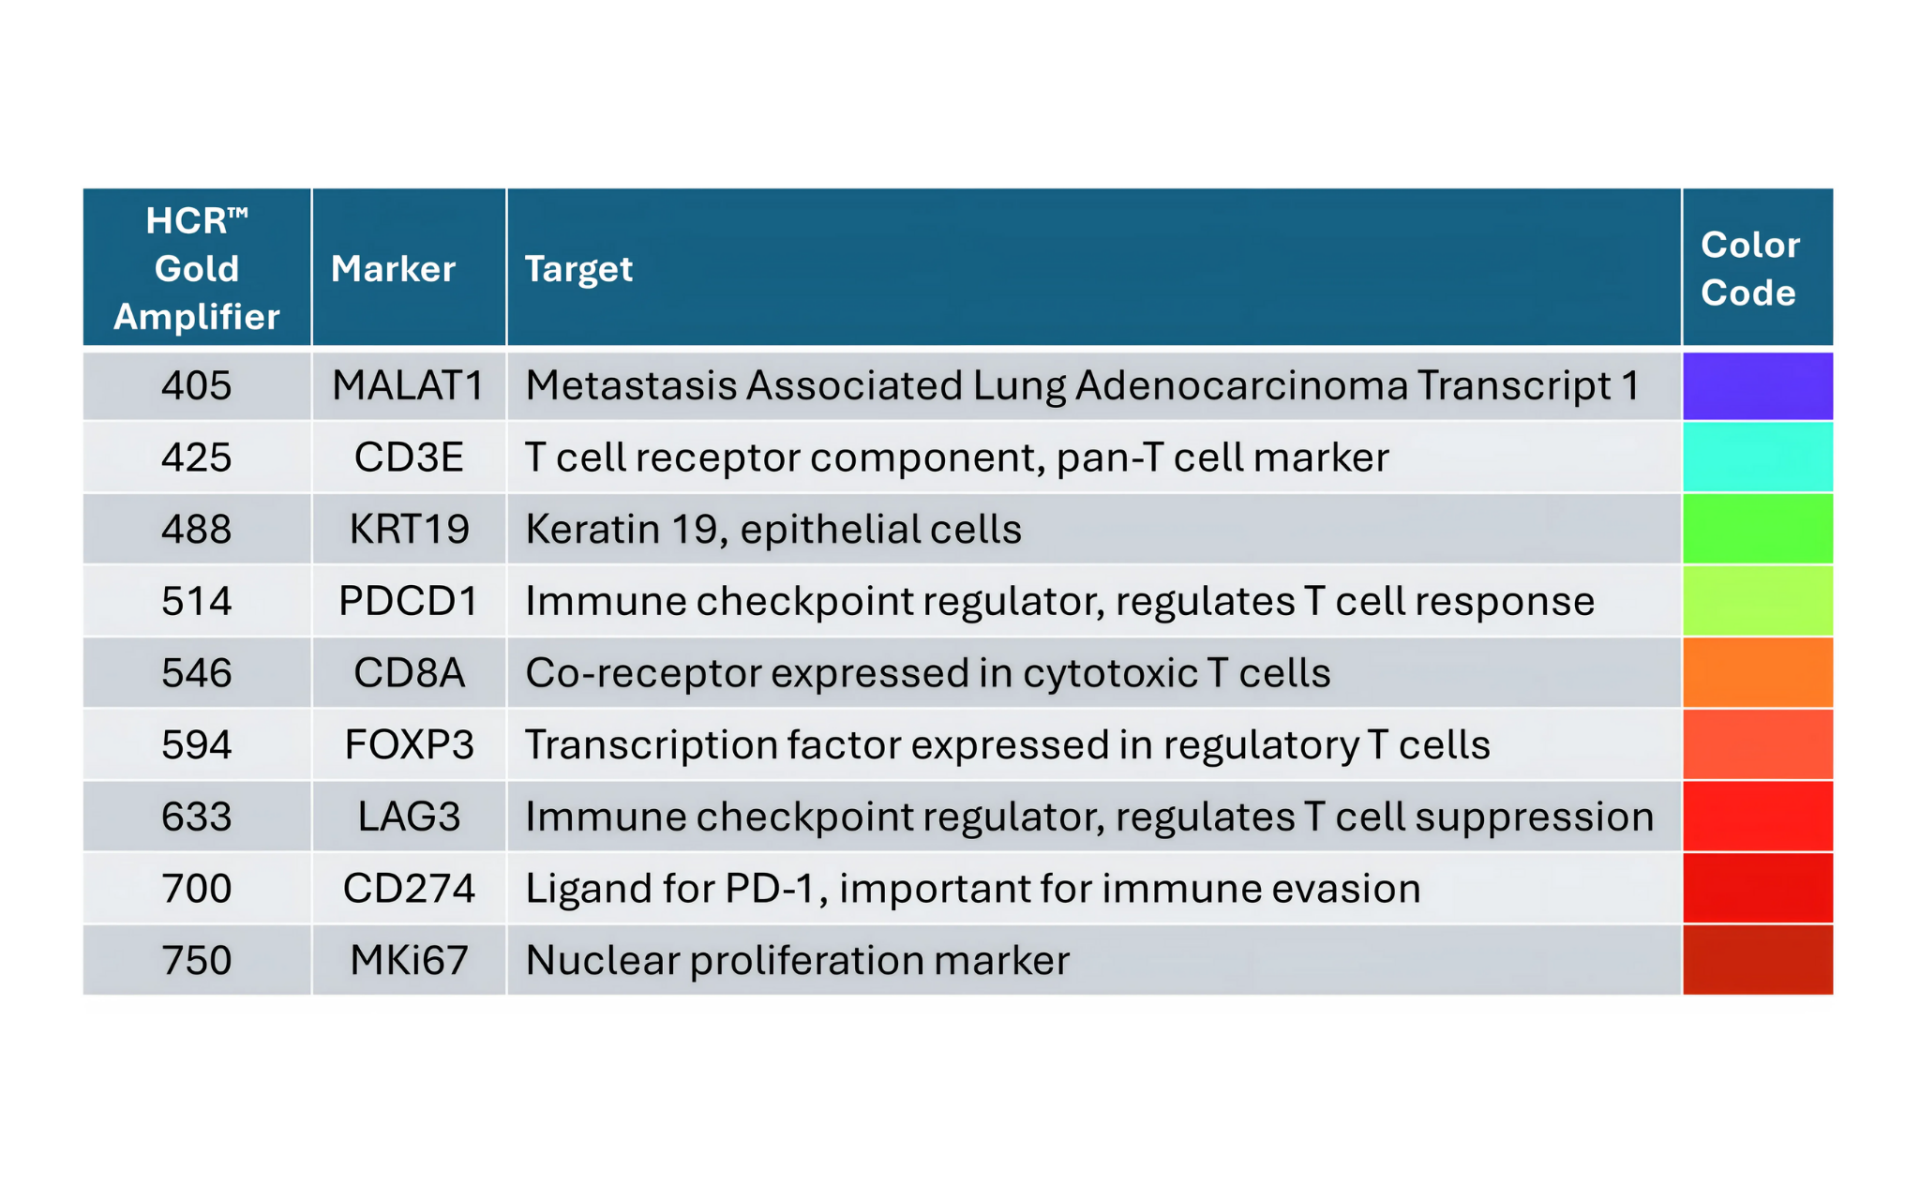
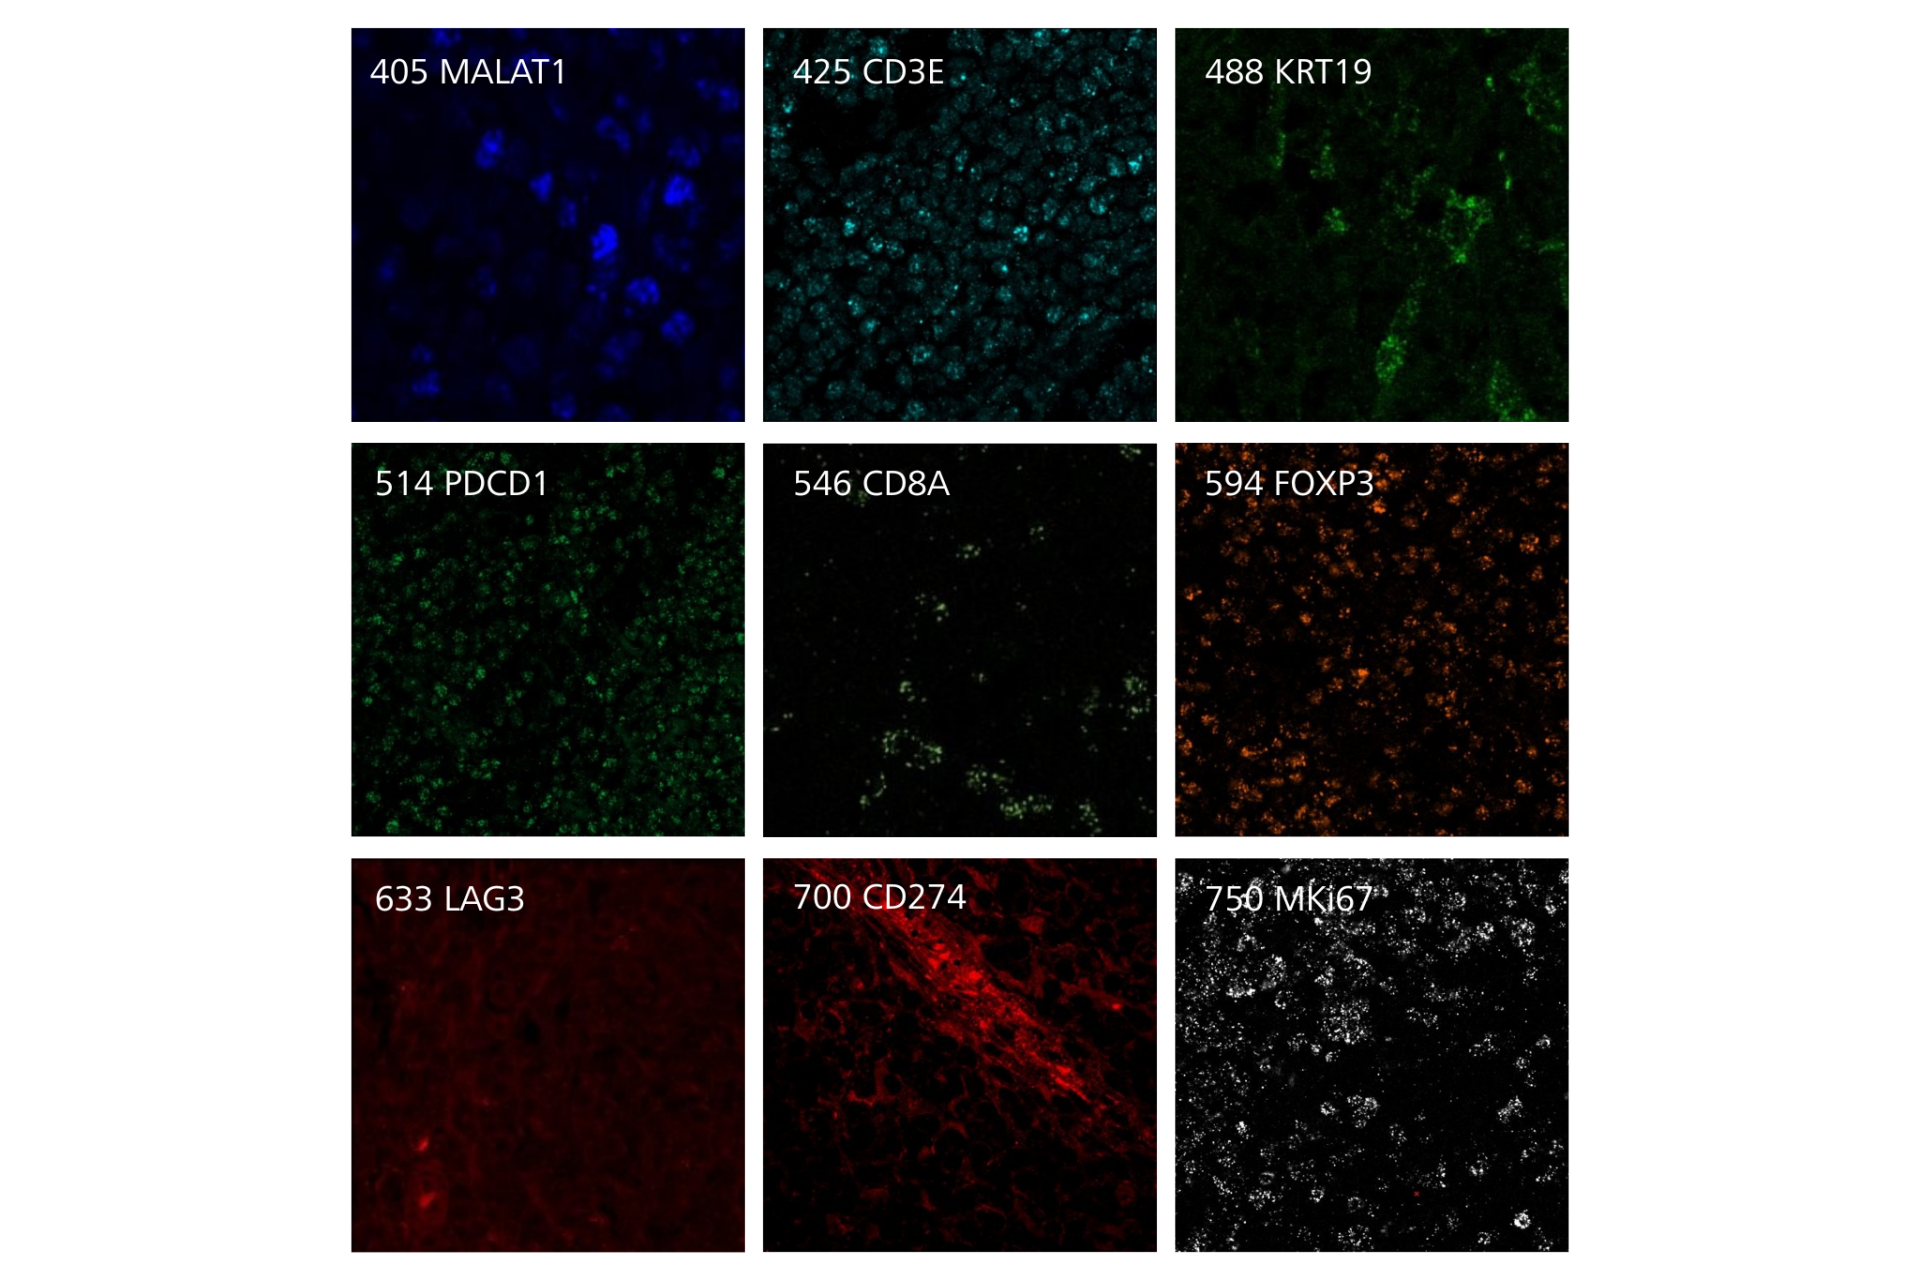
The human tonsil, a strategically positioned lymphoid organ, is designed for robust immune surveillance, featuring distinct functional regions, where a diverse array of immune cell facilitates the intricate dynamics of pathogen response and immune regulation. Understanding the distribution of the expression of different genes in the tissue, allows for the visualization of the diverse range of cell types, including epithelial cells, T cells, B cells, macrophages, and proliferating cells, as well as proteins involved in immune regulation and tumor microenvironment interactions. In this case study a comprehensive labeling panel (Figure 1B) allowed for a detailed exploration of the complex cellular architecture and functional dynamics of the tonsil, providing a foundation for understanding the spatial context of gene expression.

  • Figure 1A: Definition of the markers used in this case study and their respective emission spectra

    Figure 1A: Definition of the markers used in this case study and their respective emission spectra

  • Figure 1B: Definition of the markers used in this case study and their respective emission spectra

The spatial dimension


Simultaneous visualization of these 9 markers allows for a comprehensive understanding of cellular interactions and functional states within the tonsil's complex architecture. By meticulously mapping the spatial relationships between diverse cell types and key signaling molecules, we can uncover nuanced insights into tissue organization and biological processes that would be completely obscured when examining markers in isolation. This multi-marker approach enables the creation of a detailed spatial map, revealing how different cell populations are organized and how their interactions contribute to the overall tissue function. This level of detail is essential for understanding complex biological processes like immune responses and disease progression.

  • Figure 2A: Marker Overlay

  • Figure 2B: Pure spectra for the 9 markers. Different markers are expressed in different regions of the tissue.

  • Figure 2A: Marker Overlay

  • Figure 2B: Pure spectra for the 9 markers. Different markers are expressed in different regions of the tissue.

Resolving the spectrum

Multiplexing RNA hybridization faces the inherent challenge of spectral overlap (Image 1B), where the emission spectra of different fluorophores can overlap with each other. Accurate quantification of individual targets necessitates precise signal separation. Our LSM 990 Spectral Multiplex utilizes advanced spectral imaging to capture the full emission spectrum of each fluorophore across multiple channels. This raw spectral data is then subjected to sophisticated unmixing algorithms, which leverage the unique spectral properties of each fluorophore to accurately separate overlapping signals. In essence, the algorithm reassigns the complex spectral data into its individual components, ensuring precise quantification of RNA transcripts and minimizing crosstalk. This process is crucial for achieving high-fidelity multiplexed data, allowing for reliable and accurate interpretation of complex biological samples.

  • Figure 3: Video illustrating the ZEN Connect project that connect the
  • Figure 5A: CD8A gene expression analysis using Bio Apps spot detection.

    A. Raw data of CD8A expression

    Figure 5A: CD8A gene expression analysis using Bio Apps spot detection.

    A. Raw data of CD8A expression

  • Figure 4: Segmented gene expression data

  • C. Graph plotting the gene expression intensity against the diameter of each spot.

Analysis - Unveiling cellular interactions through spatial analysis


Beyond simple visualization, spatial analysis tools provide powerful methods for quantifying cellular interactions. ZEISS Bio Apps Spot Detection app simplifies the identification of mRNA transcripts aggregated with automated segmentation analysis within the ZEN environment. In this case study spot analysis allows for precise measurement of gene expression within specific regions of interest, revealing localized variations in transcript abundance.

Conclusion - Advancing research and discovery with spatial precision

The spatial analysis enabled by spectral unmixing and high-content expression analysis is shaping our understanding of tissue biology. By moving beyond bulk averages and embracing the spatial dimension, researchers can uncover previously hidden insights into cellular interactions, disease mechanisms, and therapeutic responses. LSM 990 Spectral Multiplex provides a powerful platform for advancing research and discovery across a wide range of fields, from immunology and oncology to neuroscience and developmental biology.

ZEISS arivis Pro
arivis logo

ZEISS LSM 990 Spectral Multiplex

LSM 990 Spectral Multiplex excels in the spectral separation of fluorescent labels. Optimize your advanced spectral multiplexing experiments with numerous protein markers and clear separation of fluorescence signals while reliably eliminating autofluorescence. Become more productive with a system that facilitates optimal imaging conditions, immediate dye identification, and streamlined workflows from acquisition to analysis.

Biopharma insights hub

Discover tailored applications

Explore applications and discover tailored solutions for you industry needs.